

Decoding the Data Science Terrain: Part 6
In part 6 of this series, we consider the aspect of learning from data. In today’s world where companies are awash in data, and Artificial Intelligence is upending business models and fundamentally reshaping industries,experiential learning is the critical skill that differentiates winners from losers.
Learning essentially means distilling insights from data and applying it to enable decision making process in a given business context. Learning involves improving the ability of humans or autonomous intelligent entities through artificial intelligence to make better decisions.
Humans can learn from data, starting with a hypothesis, designing and conducting experiments to test these hypotheses, and analysing data to make conclusions. This is applying the scientific decision making process to modern day to day business processes.
At LatentView, we see this in action every day. For example, we help a global payments platform increase their merchant sign-up rate and activation through experiments. The customer would like to understand which advertisement copies, offers and images increase the sign-up rate, activation rate or first year profits for merchants who land on their web and mobile sites. Merchants can drop-off any point during the sign-up, not just the landing page. We help them continuously design and run experiments to determine changes to the baseline web site that can help achieve their objectives.
There are many elements of their promotions / communication that can be customized, including the top banner, the headlines, the main copy, the form elements, “how it works” section, one or two other images in the body, and the footer. There are many choices for each area, and the goal is to determine the optimal combination for each traffic segment.
To accomplish this, we use the methodology of design of experiments, typically using software specifically built for this.
The process of Learning from Experiments
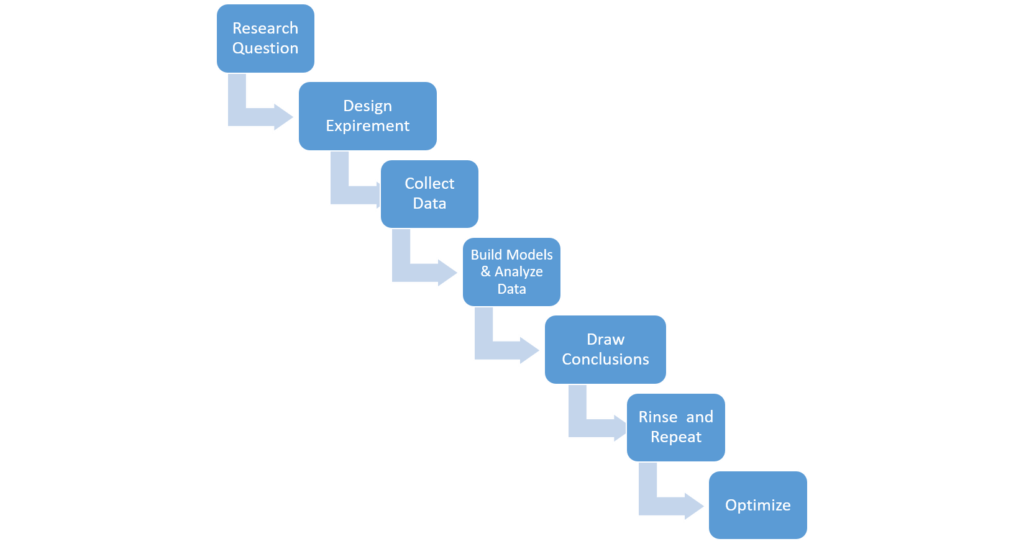
In the real world though, not all learning is driven by experiments. Managers are constrained by lack of knowledge, mindset, tools, data and other organizational issues, and these prevent them from optimizing their business through a series of scientific experiments.They may choose to undertake parts of the steps outlined above, while skipping other parts.
Here’s a framework for classifying different types of learning in an organization. The left side highlights the key business questions, and the right side describes the approach to answering these questions:
| Key Motivating Question | Analytics Approach |
|---|---|
| What happened? Examples: Which of my clinical trial sites are performing well? How many profitable paying customers have left us this quarter? | Reporting, Visualization, Ad-hoc analysis Advantages: Easy to build and deliver to end users. Visualization is a great way of telling stories, especially to senior business audience Cautions: People in organizations have access to too many reports when they are already struggling with information overload. With a few notable exceptions, today’s visualization approaches are either too complex, or they are not sufficiently flexible for managerial needs |
| Why something happened? Examples: Why is patient recruitment so low in certain trial sites? Why are customers leaving us? Which segment of customers are leaving us? What attributes are correlated with poor performance? | Exploratory analysis & Exploratory Modeling Advantages: Helps get deeper into the underlying causes of behavior or results, when data is well integrated Cautions: Not every analysis leads to insights. While some of the findings from exploratory analysis are interesting, they may be orthogonal to the problem at hand. Confirmatory and other cognitive biases can lead to inaccurate conclusions |
| What is likely to happen in the future? Examples: Which of my customers are likely to attrite? Which of my current trials are likely to overrun their cost and time? What is the sales forecast for the next week, month, quarter, and year, by product, category & geography? | Statistical Modeling, Machine Learning Advantages: Future-focused, not rear-view mirror. Helps make accurate decisions Cautions: Quality of the model is only as good as the quality of the data. Need to ensure unseen biases are adjusted as the model is deployed. Also, many anti-patterns are common in modeling, needs to be avoided |
| What happens when I change X, Y, Z? Examples: Which combination of layouts, creatives and messaging increase / decrease the sign-up rate for each of my major target segments? | Design and Analysis of Experiments Advantages: Not everything can be modeled apriori. This approach helps determine the best possible combination of factors that influence desired outcomes Cautions: This is a sophisticated science and requires thorough knowledge of statistics or Experiment Design methods, and a mindset of continuous improvement |
| What is the best course of action? Examples: How should I allocate my repair service techs to various jobs this week, in order to maximize service order completion rate, given their level of skill, specialization, capacity available, geographic location and forecast demand by category? | Optimization Advantages: Optimization helps make the right set of decisions given a complex set of factors that impact outcomes Cautions: This is a sophisticated science and requires thorough knowledge of optimization methods. Not every business decision can be formulated as an optimization problem |
| How can I build agents that perceive and act on real world stimuli? Examples: Self-driving cars, game playing bots, conversational interfaces, manufacturing robots, etc | Artificial Intelligence Advantages: AI is poised to transform the world, by automating many tasks, and ending the drudgery of work Cautions: The quality of AI is determined, to a large extent, by the quality of data (biased data will lead to biased AI). Moreover, AI techniques emerging today (especially Deep Learning) are more of a black box, more study is needed to understand how & why it really works. There are also many ethical dimensions of AI as it pertains to the decision making process. |
Let’s look at each of these briefly:
Reporting & Visualization
Reporting and Visualization has garnered lots of mindshare over the last two decades, and they are a defining feature of any BI / analytics landscape. Visualization is closely related to data availability and data preparation.
There are hundreds of tools for visualization, but Tableau and Qlik are some of the most popular ones. The most common approach to visualization is to build the specific charts, tables and widgets and embed them into dashboards that are then distributed to the users. While traditional approaches to reporting emphasized a robust data model and enterprise-wide deployment capability, modern tools emphasize flexibility and speed.
One of the trends in visualization is to reduce cognitive overload on the end users arising from too much data and not enough insights. To address this problem, visualization technologies are moving towards providing a natural language interface for users to query, as well as to describe the results. User will be able to create visualizations using a conversational interface (rather than code). This technology is expected to reduce barriers and broaden adoption of visualization tools. Moreover, visualization tools are providing narrative capabilities, i.e. provide insights in the form of narratives or stories, rather than tables and charts. In addition, visualization technology is converging with more advanced analytics, whereby they are surfacing hidden patterns embedded in data through data mining, and also making it easy to undertake exploratory analysis.
Exploratory & Statistical Analysis
Exploratory Analysis is an approach to analyzing data sets with visual methods. The starting point for exploratory analysis is summarizing the characteristics of datasets. Apart from this, exploratory analysis is used to formulate and statistically test hypotheses, discover new insights about the data or undertake deeper analysis to discover answers to specific questions through SQL or languages such as Python or R (using Pandas and R Data Frames respectively). Statistical analysis is used to undertake hypotheses testing or building confirmatory models.
The major trend in exploratory analysis is the use of Notebooks (such as Jupyter or Zeppelin). Notebooks are a convenient way to undertake analysis using one of several languages (R, Python, SQL, Scala, etc.), connect to heterogeneous environments, undertake visualization, build models, document workflow, version management and collaborate with others. They allow end users to connect to heterogeneous environments such as databases, big data tools, etc. on premise, or on the cloud. One of the newest trends in Notebooks is their ability to expose their work through RESTful interfaces.
Probabilistic Modeling & Machine Learning
This is a subset of Artificial Intelligence which involves building models to predict the future. There are many classes of probabilistic modeling and machine learning: classification models (good or bad borrower), regression (amount of expected charge-off), nearest neighbors & collaborative filtering (recommendation engines), sequence modeling (delinquency bucket next month), time series (sales by SKU by store by date), etc. Arguably, this is the subset of Artificial Intelligence that has witnessed maximum real-world adoption.
The major trend in the area of machine learning is the rapid adoption of Big Data and open source tools for modeling. The R programming language, Python’s Scikit Learn, Apache Spark, are some of the most popular tools that are used by data scientists to build the models. Moreover, these tools are being used in Notebook type environments (as described previously).
This work is primarily done in two modes: exploratory mode (feature engineering, modeling & validation), and exploitative mode (scoring and deploying in production). There are many anti-patterns that data scientists need to watch out for, when building and deploying models, and this would be a subject of a future post.
Design & Analysis of Experiments
DOE, as it is known, started off with agricultural experiments conducted by Ronald Fischer targeted at improving crop yields. Over the decades since, it has been adopted in manufacturing, chemical industries, and more recently, in marketing and advertising. DOE has general applicability to improve the decision making process in a broad range of areas, and hence it’s being enthusiastically adopted for managerial decision making.
There are fundamental challenges in large scale adoption of DOE in marketing, advertising and other service industries. For one, there is a general lack of awareness and knowledge of the methodologies and the benefits. Secondly, unlike inputs-driven agriculture, or process-driven industries such as chemicals, or precision manufacturing, performance in marketing or advertising is subject to larger dose of randomness as well as human element (e.g in customer service or sales).
However, DOE adoption in advertising, communications and marketing is increasing significantly over the years. This ranges from simple testing of one or two factors at a time to large scale testing of tens of factors, each with many levels. Most of the design and analysis are performed using specialized software such as JMP.
Optimization
Optimization is the science of finding the best solution from among the set of all feasible solutions. Optimization has wide applicability in manufacturing, airlines, operations research, control engineering, and many other fields. Recently, optimization techniques are being applied to marketing and advertising in order to maximize the effectiveness of every marketing dollar spent.
There are many classes of optimization problems such as stochastic vs deterministic, discrete vs continuous, single vs multi objectives, unconstrained vs constrained optimization, etc.
Optimization models involve identifying the objective function, determining the variables,defining the constraints and enabling the scientific decision making process. There are two stages in building an optimization solution: modeling and solving. Modeling involves formulating the problem correctly. Solving comes into play once the modeling is complete. Solving involves finding a solution to a specific instance of an optimization model.
Artificial Intelligence
The main areas in Artificial Intelligence are Statistics & Machine Learning (incl. Deep Learning), Knowledge Representation & Reasoning, Natural Language Processing, Computer Vision & Robotics.
Let’s look at each one briefly:
- Probabilistic Modeling & Machine Learning: Described previously
- Optimization: Described previously
- Knowledge Representation & Reasoning: store information and use it to answer questions or draw conclusions. e.g. Chatbots that hold conversations with customers and answer their questions
- Natural Language Processing: Recognizing speech, interpretation, automatic summarization, identify entities, analyze sentiments, translation, search, etc.
- Computer Vision: Perceive objects in the real world and extract information for tasks such as recognition, navigation and manipulation
- Robotics: Manipulate objects in the physical world
A recent trend in each of these is the impact of Deep Learning on each of these areas. Many of today’s Deep Learning models are based on Neural Networks. One of the major successes in Deep Learning is in the area of image classification recognition. The use of Deep Learning has also contributed to significant improvements in speech-to-text models, as well as in NLP. Apart from this, Deep Learning is now a mainstay in predictive modeling (forecasting, classification, regression, recommendation engines, etc.).
Large scale Deep Learning has been enabled by the recent availability of open source tools such as TensorFlow, as well as the ability to run on GPU-based hardware. Moreover, specialized hardware designs are being created specifically for Deep Learning, and this only makes life more interesting.
Read part 1 of our blog series on ‘Decoding the Data Science terrain’ and learn more about the Data Science and Analytics framework. Click here to read part 2 of our blog series on ‘Decoding the Data Science terrain’! Find out how to evaluate the quality of data in part 3 of our blog series on ‘Decoding the Data Science terrain.’ Understand the steps in the data collection process in part 4 of this series. Learn the key considerations of storing and processing data in the context of analytic needs of the users in part 5 of our blog series on ‘Decoding the Data Science terrain.


