Decoding the Data Science Terrain: Part 4
In the three previous posts in this series, we talked about a framework for mapping the data science terrain (part 1), discussed ways to monetize and extract value from information (use cases, part 2), and look at all the sources of data (part 3).
In this post, we will talk about the steps in the data collection process, before it is prepared for modeling and analysis. Typically, data is extracted from sources and collected into a staging area, from where it is transformed for analysis. There are many architectural patterns for moving data from sources through staging area to the final analysis data store. This post focuses on the data extraction process, while the next post will focus on the data transformation processes to make it ready for analytics.
Data sources come in many shapes and forms. The graphic below describes various considerations for creating a robust data extraction process for different types of sources, assessing the quality of extracted data, storing useful catalog information to make further steps in the analysis process easier, and finally discuss strategies for extracting only the data that has changed.
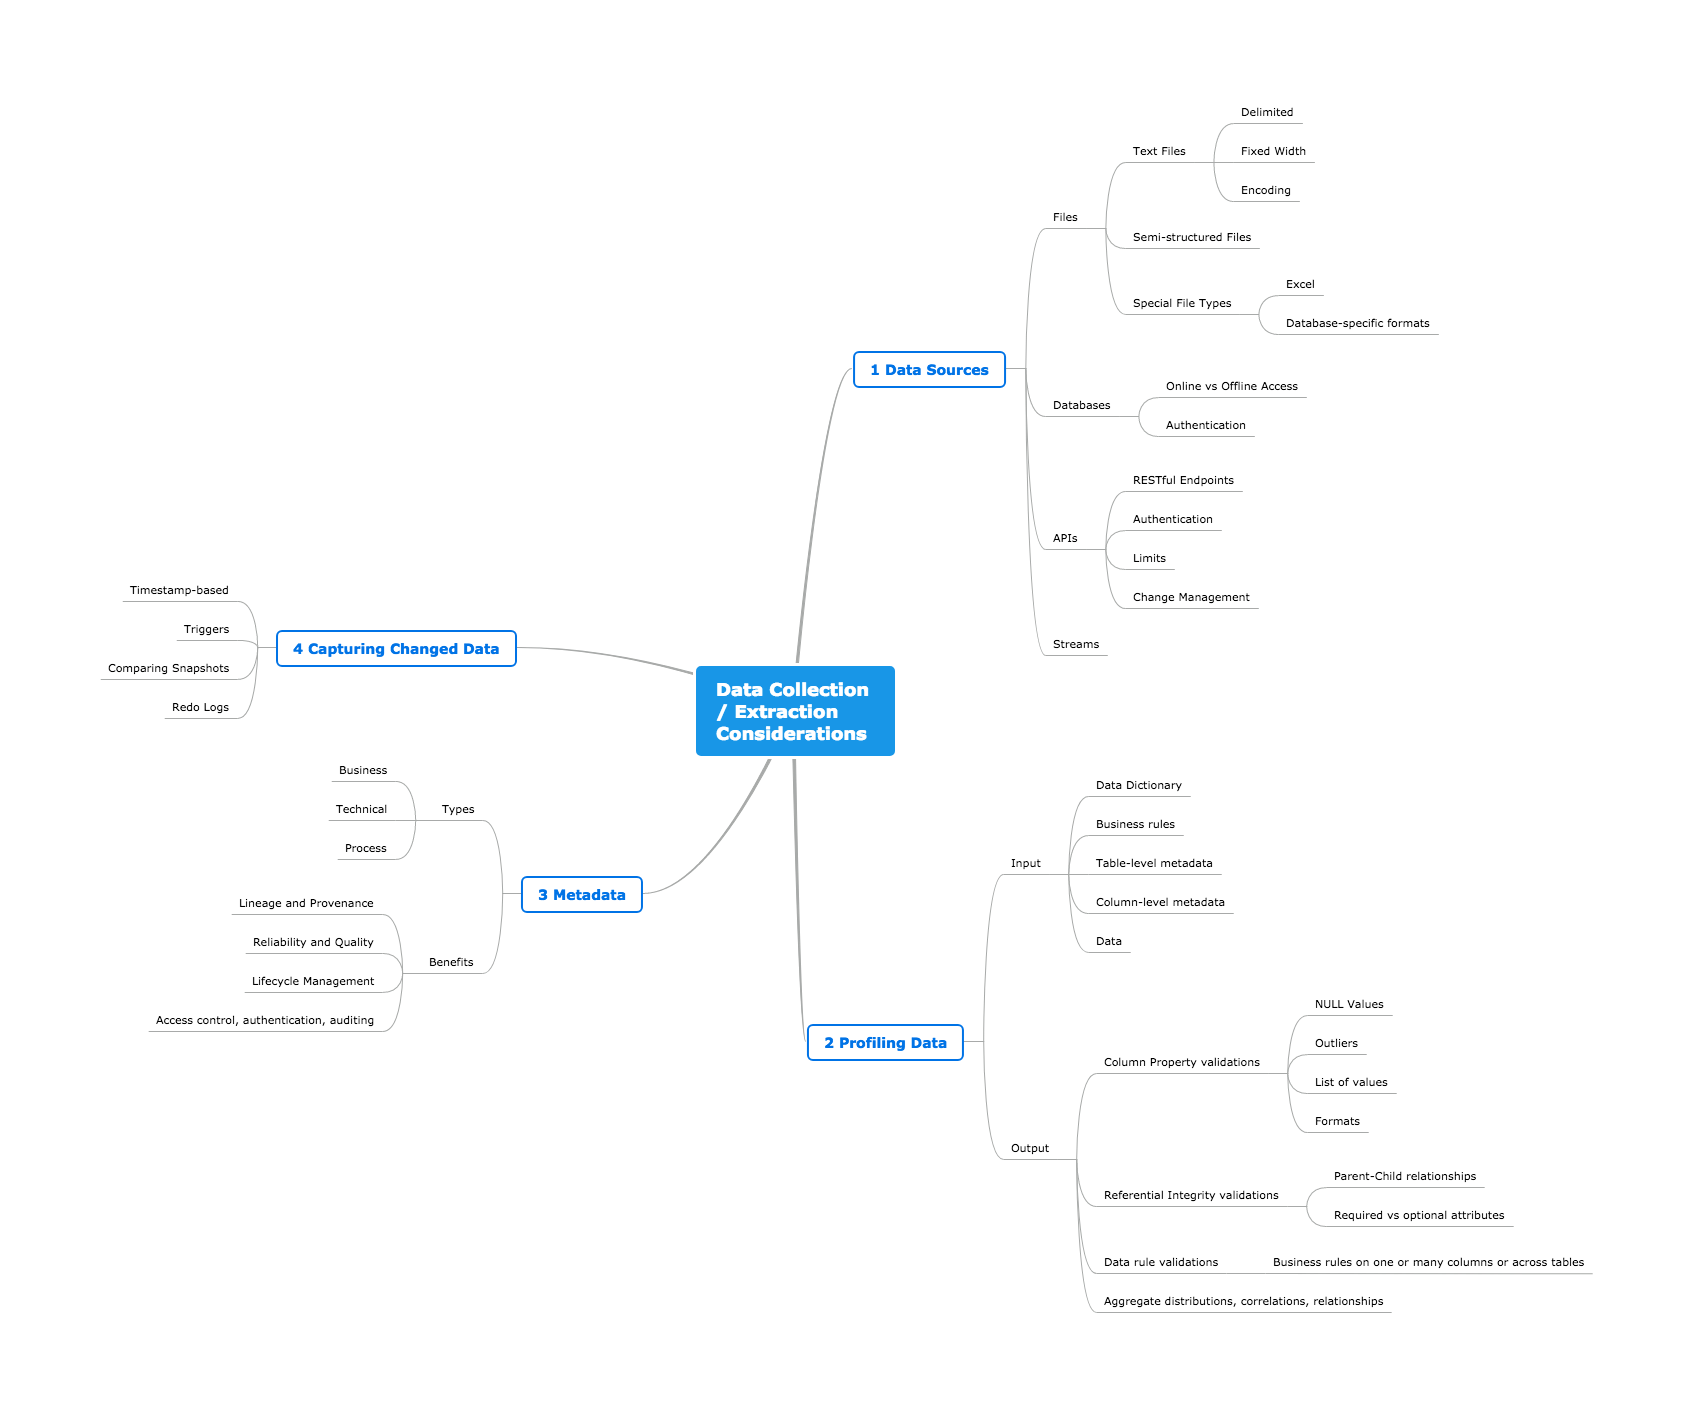
Click on the image to enlarge
1. Data Sources
There are many types of data sources in a typical enterprise. Let’s look at some of the most common ones.
Files
Files are easy to handle, since they can be compressed, transported and many of the common file types can be viewed by humans.
The most common file type used as a data source is a text file. Text files could be either delimited (each column could be separated by a comma or a tab, and each row could be separated by a new line indicator) or have columns of fixed width padded with spaces (each record occupies certain number of characters or bytes).
JSON or XML files are semi-structured, in the sense that they may have their own schema (a blueprint for how the data should be structured.)
Special types of files such as Excel files are best avoided when using automated data extraction step, even though modern tools such as Python or the ETL tools have the capability to read them. Many automated tools have challenges with Excel number and date formats and version compatibility issues.
Of course, files can be compressed, organized into folders and sub-folders, and their names need to be dynamically determined, based on some external parameters. While developing automated data ingestion from files, make sure to plan for scenarios when errors can happen (due to incomplete records or missing values, date or number formats, use of quotations, and many more)
Databases
Databases are one of the common sources of structured data. However, collecting data directly from databases may sometimes be unfeasible, either because it places unnecessary load on the database or because the database may not be readily accessible from programs that need to extract this information.
In such scenarios, databases can export their data into text files (or sometimes special database-specific binary files), which can be moved around easily and imported into a staging area. This method is called offline extraction.
If data needs to be directly extracted from a database (online extraction), the typical way to do this would be to make a connection using a database connection technology (such as ODBC or JDBC) and then use SQL to extract the data and pull into the destination. Obviously, one needs to make sure to have the right credentials to connect to the data source and permissions to read the tables.
APIs
Data could be extracted from third party software through Application Programming Interfaces, also known as API’s (such as web service API’s offered by numerous online services, such as Google AdWords, Facebook Graph API, Twitter API, Instagram API, online display ad platform API’s, etc.). API’s are ubiquitous across a range of domains, and they are the standard way by which data residing in third-party apps (for example SaaS apps) is consumed.
API’s could deliver data in batch or streaming mode.
APIs typically involve calling RESTful web service endpoints using HTTP (predominantly) or SOAP (occasionally). They may return data in JSON or XML formats. The API providers may also impose limits on the extent of access to promote fair usage and prevent unreasonable use, or simply as part of the business model.
In addition, API endpoints are protected through open protocols such as OAuth 2 protocol, which separates resource owner, authorization server, resource server and the client, so the data engineer needs to be aware of navigating these issues.
To promote simplicity of application development, API providers typically provide language specific libraries (such as Facebook Python API wrapper). This abstracts the underlying RESTful interface, authorization, access control and provides an easy method to pull the data or interact with the web service.
More importantly, the APIs may themselves undergo changes. Hence, it’s best to evaluate the use of an API aggregator service (such as Crimson Hexagon, Sysomos, HootSuite, etc. for Social Media domain) rather than work directly with the web service API endpoints (such as Facebook Graph API).
Streams
Life doesn’t happen in batches, and most real-world systems generate data in streams. This is as much true for modern IoT devices as for legacy business applications (such as inventory or order management). However, most applications capture data in batches and process them.
Jay Krepps, the inventor of Apache Kafka, outlined in his article an architecture based on processing data as a stream (Kappa architecture). In this approach, incoming data is streamed through a real time-layer, and the results of any further processing are delivered to the serving layer. At the heart of this architecture is a message passing infrastructure that can source data from any number of sources while also delivering this data to any number of consumers, both real-time and batch.
However, the complexity of handling data as streams arises from managing duplicates, cross-referencing events and maintaining the order of operations.
We will have plenty to talk about streaming architectures in future posts in this blog.
2. Profiling Data
As described in the previous post (part 3), it’s important to assess the quality of data for use before using it in data science and analytics. Data quality is the fitness of data for its intended use.
Data profiling is an analytical technique applied to data sources to determine the content, structure and quality of the data. Data profiling borrows ideas from exploratory data analysis to identify characteristics of data that can be used to determine its fitness for the intended use.
For simplicity’s sake, let’s consider profiling of structured data. This can be done at multiple levels:
- Column property rules: Individual columns have data values that make sense (e.g. age of customer cannot be < 20 years)
- Structure rules: Referential integrity, primary key, etc. are enforced correctly (e.g. every order has at least one line-item, and every order no. is unique)
- Data rules: Values across multiple columns or tables must have acceptable combinations (e.g. Customer cannot be in two mutually exclusive business segments)
- Aggregate-level rules: These are unspecifiable rules that are evaluated by looking at the data at an aggregate level (e.g. 95% of orders must have items shipped within 30 days)
Profiling of data can be undertaken by business analysts with help from source data owners. This can be done by through simple to medium complexity custom SQL scripts and some understanding of the metadata for the data source (such as a data dictionary). A lot of data profiling can be automated.
3. Metadata
It’s critical that we start capturing metadata right at the time of data extraction. But what is metadata, really?
As we construct data lakes, warehouses, and data-driven end user applications, it’s important to enable proper governance of these data assets. Without governance, these assets fail to deliver the promised business benefits. Capturing metadata at various points in the information supply chain is critical to proper governance.
The benefits of having a strong metadata foundation are numerous:
- First, it provides information about the various data elements, formats, and lineage, as a snapshot as well as over time
- Secondly, it allows organizations to determine the reliability and quality of data, using both formal (e.g. data stewards defining rules) and informal (e.g. analytics professionals socializing their opinions) channels
- Thirdly, data elements have an expiry data, and metadata allows organizations to manage data life cycle to optimize storage and access policies
- Finally, it enables fine-grained access control, accountability over usage of data, helps in auditing usage, and ensures better information security
Many types of metadata can be collected:
- Business metadata – the meaning of data elements, the expansion of acronyms in the values, formulas for computing metrics, segment definitions, etc.
- Technical metadata – the structure and format of datasets, the size of data, rules that govern referential integrity, rules for data quality, etc.
- Process metadata – the data provenance, lineage, the processes that generated this data, and operational characteristics of the process (run date, time, rejected records, etc.)
4. Capturing Changed Data
One of the key capabilities in creating reproducible data pipelines is the ability to capture only changed data, rather than all the data, every time.
The alternative to this approach is to delete all the data in the target analysis database, and then reload the entire history from the sources, again and again (possibly every day). However, doing this has huge drawbacks in terms of cost, time of processing and tracking critical changes in data attributes (such as names/addresses of customers, etc.).
Change data capture (CDC) is the term given to identifying and retrieving only those records that have changed since the previous extraction.
There are several ways of implementing CDC in data extraction:
- Timestamp-based: Assuming that each record has a last update date, retrieve only those records that have been updated after the previous extraction. The key drawback of this approach is that there is special processing needed for deleted records. Moreover, differentiating inserts and updates requires two timestamp columns (record created time and record updated time). In addition, multiple updates applied to a given record between two extractions are captured as a single update.
- Snapshot-based: When timestamps are not available, an entire snapshot of the source is imported into the staging area. Then, each record in the snapshot is compared with the previous value of the record in the snapshot. If the record in the new snapshot has changed or is a new record, this is marked as an update or insert respectively.
- Redo Logs-based: This approach is supported by modern databases. Here, every change to the source data is recorded in logs, which can be parsed, and the changes captured can be applied to data in the staging area to reconstruct the most recent data. The big advantage is that changes can be captured at real time. The disadvantage is that it may not work in environments which are heterogeneous (containing many types of databases).
Read part 1 of our blog series on ‘Decoding the Data Science terrain’ and learn more about the Data Science and Analytics framework.Click here to read part 2 of our blog series on ‘Decoding the Data Science terrain’!Find out how to evaluate the quality of data in part 3 of our blog series on ‘Decoding the Data Science terrain’.