

Decoding the Data Science Terrain: Part 3
In the previous post in this series, we talked about use cases or ways to monetize and extract value from information. Here, we’ll talk about the beginnings of the information supply chain, i.e. the place where data originates before it is collected, transformed into information, and learned as insights that drive optimal actions.
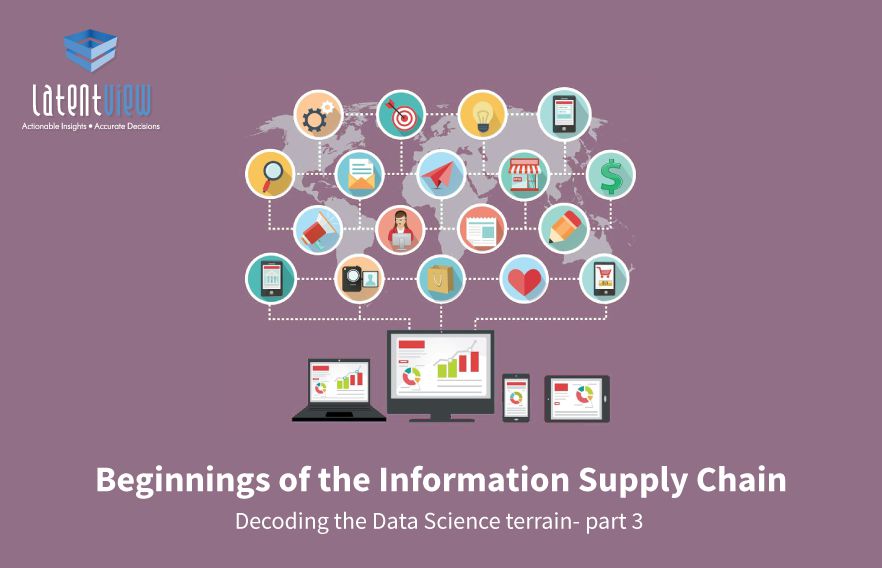
It’s a cliché to say that data is the lifeblood of any business. The variety of data sources in a typical Fortune 500 organization look as diverse as a tropical ecosystem, with huge amounts of diversity. As far as data is concerned, what’s being used today is just the tip of the iceberg.
Let’s dive into the ocean to figure out what’s actually below the surface.

To explore the iceberg, we must ask the following guiding questions:
Where do datasets reside?
Let’s talk about data sources such as Mainframe sources, files, databases, queues and streams.
Mainframes: According to Wikipedia, Mainframes are still the back-office engines behind the world’s financial markets and much of global commerce. COBOL is the dominant language for the Mainframe and the data in COBOL copybooks has some unique characteristics, including character set and encoding, representation of numeric data, etc. This adds a layer of complexity to the data supply chain process.
Files: These are used for storing structured, semi-structured and unstructured data formats. The structured data can be either fixed length or delimited. Unstructured formats such as documents, videos, voice, and images can be converted to structured formats. Some documents such as spreadsheets can contain both semi-structured and unstructured data. Files are also a great mechanism for moving data from one place to another.
Databases: This is where most data resides, and there are many types of databases, including the traditional RDBMS that dominates the landscape of structured data, and the many flavors of NoSQL, which are used for storing semi-structured or specialized forms of data. We will take an exhaustive look at the types of databases, especially in the context of storage for analytics, in the next part of this series.
Application Programming Interfaces (API): APIs are a critical and commonly occurring source of data in the real world. APIs are an open and transparent mechanism for data integration between the client consumers and service providers. Examples of APIs are everywhere: social networks, financial markets, weather data, traffic (flights, transportation), numerous consumer applications, etc.
What is the structure of data in the datasets?
Data can be classified as structured, semi-structured, and unstructured. Organizations have started capturing a wide variety of data, including text, clickstream, logs, transactions, etc.
Structured data consists of well-defined repetitive units called records, whose attributes and data types are pre-determined. Each record typically represents a transaction or an entity that has well-defined attributes. Some of these attributes can be keys, whereas others are values. Attributes have well-defined types.
Unstructured data are those for which there is no well-defined repetitive unit or structure. Examples are data in logs, images, documents, videos, free-form text, recorded conversations, etc. They can be human-generated (such as social media posts) or machine generated (such as logs and sensor data).
Semi-structured data lie in the continuum between structured and unstructured data. Semi-structured data have some repetitive units, but the attributes within this are dynamic. An example of this is XML or JSON data. It’s a grey area between structured and unstructured data.
There is a “great divide” between structured and unstructured data, and this divide is real for many organizations. Even today, most organizations do not extract structured insights from unstructured data, except in niche applications. However with the recent rise of Machine Learning (especially Deep Learning), this barrier is being broken and many of these types of applications are becoming mainstream. At LatentView Analytics, we work with social media data to predict box office performance, transcribe call data to understand the business intent of the customer, etc.
How fast does data flow into the datasets?
From the perspective of flow, data can be in the continuum of static to streaming. Static data flows very slowly, whereas streaming data flows very fast. This is obviously a subjective definition, and it’s possible to transform from one form to another to make it easier to manage and analyze.
Most data in the real world is streaming. For instance, consider visitor interactions on websites or in mobile apps, search data in online commerce, transactions in financial applications, customer data in retail, data in server logs, or sensor measurements. Everything above is a stream of events. In fact, static data only exists in data warehouses.
The traditional approach to data analysis has been to accumulate data from many sources using batch processing technologies and analyze it using batch data analysis methods. However, this may not work if you need near real-time (NRT) insights. In such cases, it’s necessary to analyze data as it arrives.
At LatentView Analytics, we have designed and implemented architectures for streaming data, as well as migrating from a batch processing to a streaming architecture. We will discuss more on how to build these architectures and its migration in a future post.
How big are the data volumes in the datasets?
Various adjectives such as big, small, etc. are subjective ways of evaluating the size of data. In today’s world (2017) “big” means petabytes of data. This would obviously not be the case 10 years later, and 10 years ago, terabytes were considered large. The amount of data stored in the digital form in the world is estimated to be about 2.7 zettabytes. It’s impossible to comprehend the meaning of this figure!
With the advent of new technologies such as databases, IoT and digitization, an increasing amount of data is being generated as well as being stored in a digital form.
Here it’s important to highlight the meaning of the term “Big Data”, whose definition goes well beyond the size of the data. According to Doug Laney who coined this term:
“Big data” is high-volume, velocity and variety information assets that demand cost-effective, innovative forms of information processing for enhanced insight and decision making
Obviously, Big Data includes data with large volume, and in addition to the datasets, Big Data includes the technologies that process all of this data and deliver insights for effective decision making. The extreme hype around Big Data leading to subsequent disillusionment was mainly caused by vendors and executives who neglected to emphasize the second and third aspects of the definition, namely the cost-effective information processing and the insights for decision-making while over-emphasizing the 3 Vs (volume, variety, and velocity).
Large volumes does not automatically mean high value. For instance, clickstream data can be huge, and it may contain valuable customer behavioral information. However, monetizing this information by extracting useful patterns can be quite a challenge, perhaps because there may not be any new insights that are worth the effort required to process all this data. However, some of the transaction data, while relatively smaller in size, can hold an enormous wealth of information that’s critical to deriving deep insights and driving competitive advantage.
So, it always makes sense to start with the use case. Size does not always matter.
What is the quality of data in the datasets?
Data quality is the fitness of data for its intended use. There are many dimensions of quality, including accuracy, timeliness, completeness, etc.
Accuracy: A dataset that’s accurate for one purpose may not be accurate for another. For example, a dataset that contains data matched from a phone calls database and web visits database, using fuzzy matching logic may have an accuracy rate of 60%. This may be accurate for understanding customer behavior trends across channels, but may not be accurate enough to construct a comprehensive profile for each customer.
Timeliness: In a distributor organization, the structure may change quite often, because of the realignment of sales territories. It takes the data warehouse about 30 days to see these changes. While the datasets in the data warehouse can be very useful to analyze trends, it cannot be a good source for computing bonuses and commissions to be paid to sales teams.
Relevance: In a large distributor organization, a syndicated dataset obtained from third parties contains detailed summary of sales of various SKU’s by different outlets for own and competitor products. However, the SKU information for competitor products does not contain detailed product information necessary to make an accurate comparison.
Completeness: A recommendation system generates sales recommendations which are then delivered to various sales teams who interact with their enterprise clients. The sales teams can look at these recommendations and then make offers to their clients. However, improving the quality of recommendations requires the sales teams to provide feedback on whether the recommendations made were used or not, and whether the customer decided to take up the offer. Without this feedback loop, it is impossible to improve the recommendations.
In the next post, we will look at how data quality can be assessed using data profiling methods.
In summary, we have seen that datasets reside in many places across the organization, and it’s important to understand the complexities of accessing the data. Datasets can have a huge variety in terms of structure which can present quite a bit of challenge in using them for analytics. They can come with different flow velocities and it’s important to trade off the complexity of a near-real-time processing architecture with the potential business benefits of doing so. Datasets come in various sizes, but size does not always correlate with value. Last but not the least, it’s necessary to evaluate the quality of underlying datasets across certain dimensions before we begin to use them for a particular use case.


