


AB testing is a data-driven approach to compare two different versions of a web page using statistical techniques. Ever since internet accessibility was made easier, the search engine industry has attracted more users, increasing competition among companies that provide search engines to fulfill consumers’ evolving needs.
Companies offering search engines need a data-driven approach to enhance the product to stay on top of the trend and compete. The power of AB testing is the ability to read the user’s sentiment towards the feature before rolling out the change to production. By implementing controlled experiments, we get strong evidence from the data to make a business decision that can make a massive difference in Return on Investments. Also, we can save time and effort by comparing multiple versions of the page against the current page.
This blog will consider search engine AB testing for illustration purposes and discuss feature development and experimentation lifecycle.
AB Experimentation Workflow using a Search Engine Example
Importance of Feature Analysis During Development
Developing a feature is the most vital step in AB testing. If we don’t do a feature analysis before the experiment, we might lose users who aren’t satisfied with the change. One example would be overloading a page with several new elements. This might increase page load time, and we could lose users who get frustrated due to an increase in waiting time. So, each feature under development needs to have clear design documentation and expected impact. In search engines, testing can be applied to both front-end (example – changes to page elements like text size, color, icons) and back-end (example – changes to page ranking algorithms) changes. Let us take a use case to understand this better. Monetizable searches bring more revenue. Typically, sponsored advertisements are shown first amongst the results. Most of us tend to scroll down as we are only interested in organic results. Below is an example where the ‘Ad’ indicator is moved to the description section making it hard to recognize and thereby increasing the click-through rate for ads. Results of this experiment are given in Table 1 in the next section.
Experiment Lifecycle
Almost all the features deployed to production need to pass AB experiment checks. Therefore, it’s always a safer bet to test your feature performance using the AB experiment and cross-check the business hypothesis with the observed effect from experiment results.
- Pre-Experiment Checklist
| Control (C) | The production version of the page |
| Treatment (T) | The new version of the page with the developed feature |
| Sample Size | Total users split into either T or C (Randomly split to overcome selection bias) |
| Duration | Experiment duration (usually 1/2 week to capture weekly seasonality). |
| Statistical Test | Test that compares metric averages between T & C group to label significant movements.Parametric test: Student t-test / Welch’s t-test |
| Confidence level (CL) | The minimum probability of observed results happened due to the change. It is used to label movement as statistically significant or not. Usually set at 95%. |
| Minimum Detectable Effect | The expected impact from the feature. Example: In the above ‘Ad’ indicator experiment, we could expect user clicks to increase by a minimum of 3% and later observe the actual effect to see if the feature is underpowering or outperforming. |
- Run the Test and calculate the metric averages & p-value.
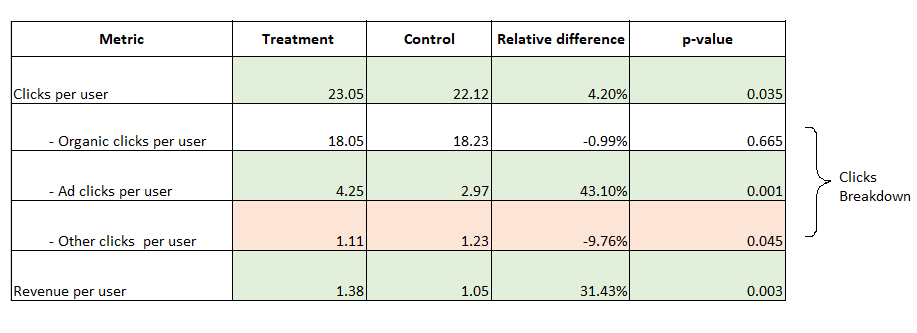
Here are the results of the experiment conducted based on ‘Ad’ indicator placement.
- Correlate the Results With the Business Hypothesis and infer the significant movements using the P-value (1 – confidence level). P-Value is the probability of observing results that happened due to chance.
For example, from Table 1, we see that Ad clicks per user have increased by 43.10% in treatment with a p-value of 0.001. This means there is a 0.1% chance that the observed increase (43.10%) in ad clicks is due to a random chance. Conversely, we are 99.9% confident that this increase is due to our feature. In Table 1, the highlighted positive and negative metric movements happen by considering a 95% confidence level or p-value of 0.05.
- Power Analysis: As the name suggests, this analysis helps us determine how powerful the statistical test is in labeling a true metric movement as statistically significant (True Positive Rate).
Minimum Detectable Effect (MDE) is the minimum possible effect that the test can detect. In practice, some metrics would be underpowered, which means the test cannot label the metric movements as statistically significant because the observed effect is lesser than MDE. In such cases, we need to perform power analysis and alter the power and sample size so that the observed effect is greater than or equal to MDE. (Default power is 80%)
We will consider Organic clicks per user metric from Table 1 and perform a power analysis to calculate MDE for the Control value (18.23) at different sample sizes and power.
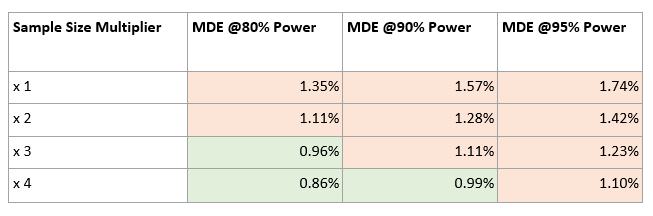
We can see that this metric is underpowered as observed effect |- 0.99%|is lesser than 1.35% (MDE at 80% power and sample size used). The numbers from the table show that we need to ramp up the sample size to make sure the metric isn’t underpowered.
- Perform a Drill-Down on Metric Movements: Slice the results on multiple dimensions to identify the root cause for metric movements. For example, some metrics might underperform specifically in a certain region/country, browser types, etc. This will help us find the cause of any negative movements and help us to address them during the next iteration of the feature.
This is the first blog of a two-part series on AB Testing, Click here to read the second blog on AB Testing validity checks and best practices.


