Businesses are well aware that analytics is changing everything – and that the difference between simply surviving or thriving, hinges on how they interpret and utilize data. Through analytics, organizations gain insights that drive decision making about everything from marketing and customer support to accelerating product innovation. However, often the data that holds the greatest business value- unstructured data, is going untapped.
Unstructured data comes from many channels and sources, both conventional and emerging. Conventional data sources often include: survey data, web browsing data, product purchase data and focus groups. Emerging sources can include social media data, connected devices/wearables, mobile data, customer service/customer experience data.
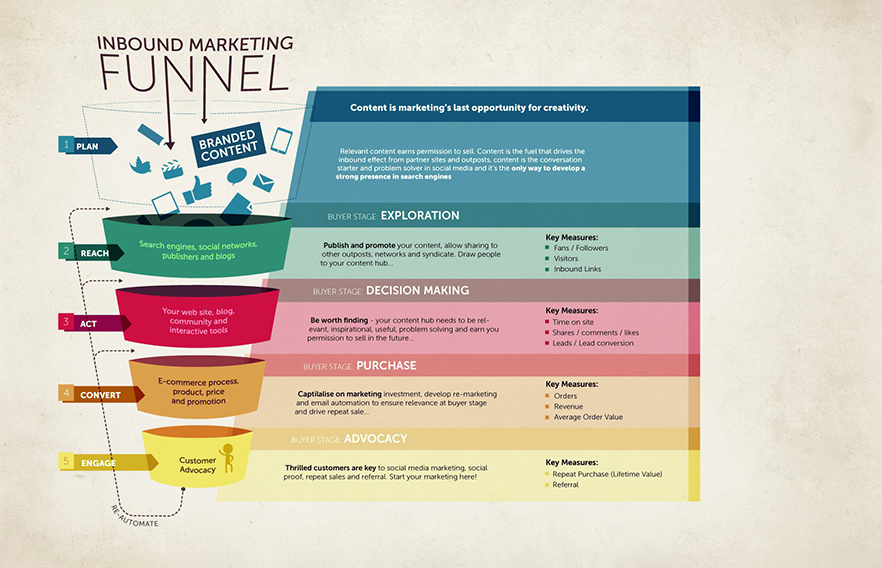
Combining the information from all of these sources gives a company a critical view of how customers perceive its brand and how the business is stacking up against competition. In fact, applying a custom analytics model to unstructured data with literally thousands of data points, can reveal deep insight into what drives customers’ purchasing decisions. The average customer commonly moves through a process that is described as the “purchase decision funnel.”
There are six stages in this funnel:
In the upper funnel:
- Brand awareness: share of voice (SOV) compared to competitors
- Brand perception: how closely a brand is associated with key features for an offering (i.e., performance, reliability, cost, etc.)
- Digital engagement: how effectively a brand engages with potential customers across the digital channels of web, app, social media & YouTube.
In the lower funnel:
- Brand consideration: how frequently is a brand present in multiple brand conversations
- Buying experience: how satisfied is the customer at the time of purchase, versus competitor brands
- Owner engagement: post-purchase customer advocacy
Intelligence gathered from unstructured data analytics can help brands adapt their business to address gaps in these critical areas. For instance, a brand can invest resources into improving its online SOV to influence consumers at the upper part of the decision funnel, or it can invest more in the customer experience process after a purchase, to create greater loyalty and drive engagement at the lower end.
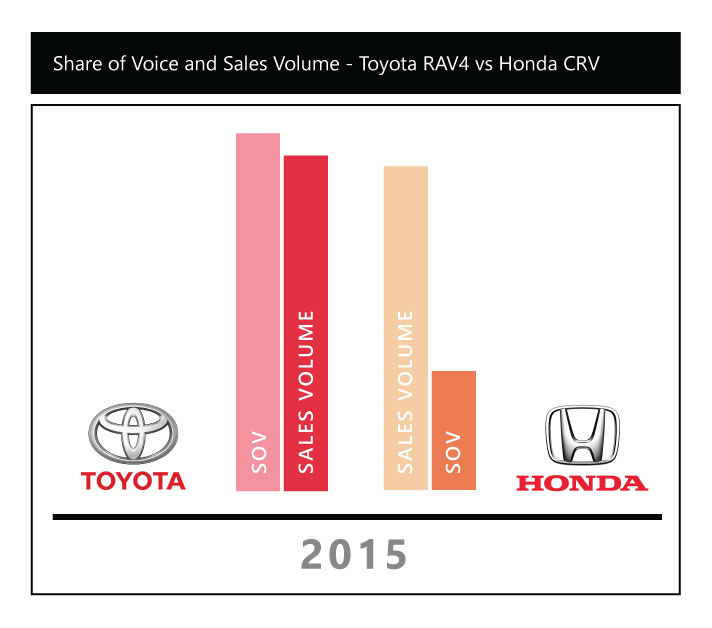
The influence that higher SOV can bring to a brand is at times a double-edged sword. Consider the case of Toyota & Honda compact SUVs (Rav4 & CRV), where Toyota RAV4 had a three times higher SOV compared to Honda CRV in 2015, yet were roughly equal in terms of a sales volume. Toyota RAV4 was plagued by the seat belt recall issue which dominated the social conversations and potentially impacted the customer purchase decisions.
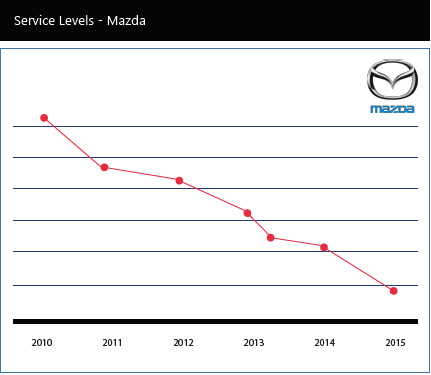
Similarly, Mazda is popular for its comfort and design among consumers and is very also fuel efficient as per internal test data. However consumer perception does not reflect this. Mazda’s service sentiment is also low and service levels has been on decline between 2010 to 2015. So future campaigns need to possibly address these issues. Improving this could further enhance the number of Mazda brand advocates.
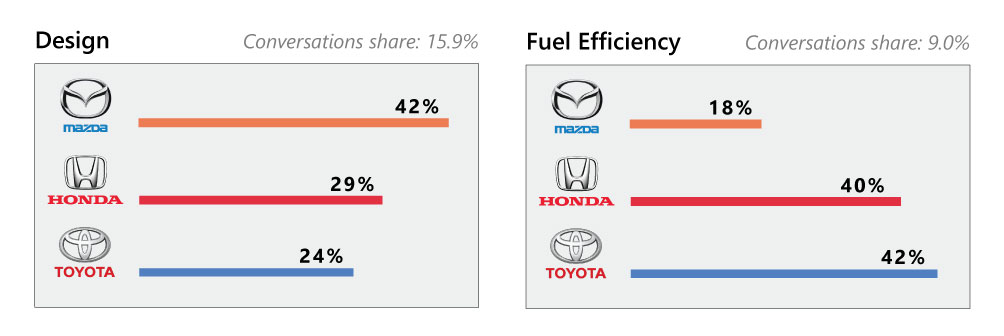
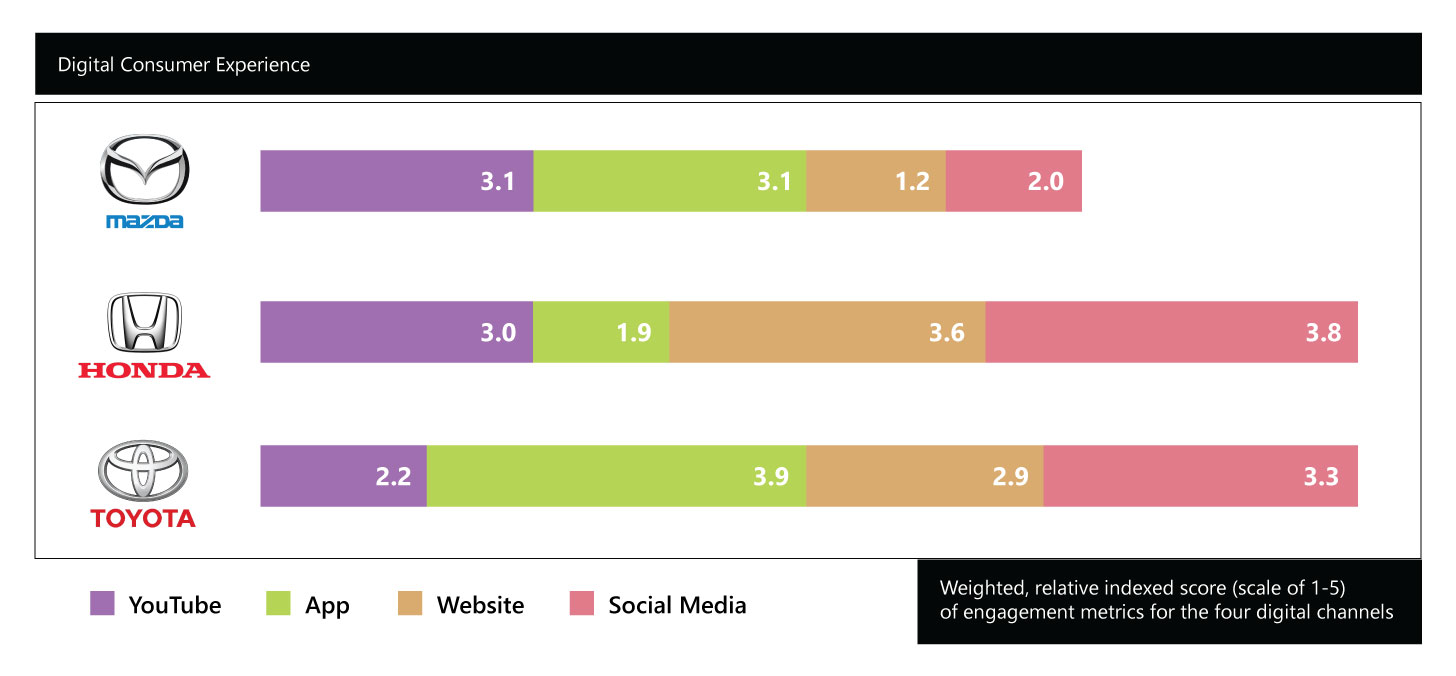
In the one year SOV comparison between Honda CRV, Mazda CX5 & Toyota RAV4, Honda despite having a share of voice that was three times lower than Toyota RAV4, exceeded its rival in sales possibly due to the positivity of those conversations. In the upper funnel it was observed that Honda has strong associations with key features like performance and comfort and Mazda has weak associations in the consumer’s mind across multiple features. It was also observed that Mazda was lagging in the digital consumer experience.
For the lower funnel it was observed that Mazda appears less frequently in the brand consideration set. While Mazda was rated high when it came to sales satisfaction it scored low in prospect satisfaction, suggesting potential lapses in prospective customer experience at dealerships. Now that the indices can be obtained at a dealership level, the data could also be analyzed further to identify dealerships that need improvement and dealerships that are performing well; this will enable cross learning opportunities. Specific measures like product genius as adopted by Apple retail can be put to test in select dealerships and improvement monitored using these indices.
The decision funnel can reveal insights into brand perception to help senior management compare desired and actual perception for their brands. This allows them to adjust their strategy and develop messaging to bridge the gap.
Going back to the case of Mazda, the sentiment around its service is low and has been on decline between 2010 to 2015. Improving this could further enhance the number of Mazda brand advocates. Nissan has shown significant improvement in overall customer retention after it gained a set of loyal customers for it’s niche electric car – Nissan Leaf, aided by the IHS loyalty automotive awards.
If you are seeking to strengthen your brand, gain competitive advantage and boost sales and revenues, mapping out the decision funnel needs to be your starting point.