


Introduction
Industries have increased their adoption of cloud infrastructures and on-premise services to increase their operational capacity. As a result, the quantity of data on these services/applications’ performance and the status of operational requirements have also increased. Therefore, health checks of these applications and various metrics that define the operating status have become very important for error-free delivery. Log Analytics is a technique that can be applied here to analyze the data generated by these applications to understand and track the performance and give a health report of the application.
.log and Log Analytics
A log is an automatically generated event or set of events related to a particular task executed in a system or a function. Log analytics helps leverage this set of events in analyzing the performance and health of any system that’s being constantly utilized to perform critical operations. It allows a user to perform real-time analysis of large-scale data and obtain insights for various applications, including digital marketing, application monitoring, fraud detection, ad tech, and IoT. Log analytics also helps look at the bigger picture and reactively mitigate risks, comply with security policies, audits, and regulations, and understand online user behavior.
Azure Application Insights is a perfect tool to save the log data generated by these applications and also offers multiple features to apply Log Analytics on the saved data.
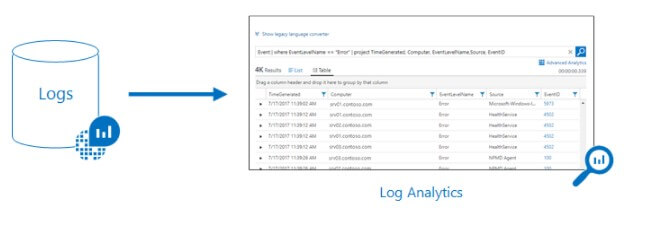
Source: Azure Monitor Documentation
Introduction to Azure Application Insights
Azure Application Insights is a feature of Azure Monitor and an application performance management service for web applications. It enables you to monitor web applications by installing a small instrumentation package (SDK) in the application or by enabling Application Insights using the Application Insights Agent if supported. Application Insights will automatically detect performance anomalies and include powerful analytics tools to help you diagnose issues and identify what users do with your app. It also provides connection points to various development tools and integrates with Visual Studio to support the DevOps processes.
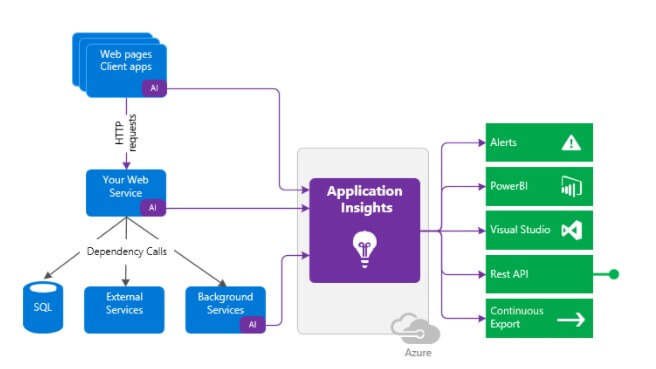
Source: Application Insights documentation
Pipe away with a new query language
Azure Application Insights uses Kusto Db to store all the log information and Kusto Query Language (KQL) to query that information. KQL is a read-only query language that processes the data and returns results. It uses a pipe (|) operator to concatenate all statements.
KQL is a simple language, similar to SQL, focusing more on modeling the statements in sequential order. Their flow depends on the tabular data generated at the end of each statement. However, in contrast to SQL, the query in KQL starts with table names instead of select statements and is followed by a set of conditions. The query ends with a “project” or “distinct” statement with a chosen set of columns to be displayed. While the logic stays the same as SQL, there are different keywords for specific operations, such as

whereas other keywords such as WHERE, JOIN stay the same.
For example, the following Kusto query has a single tabular expression statement. The statement starts with reference to a table called StormEvents. The data (rows) for that table are then filtered by the value of the StartTime column and then filtered by the value of the State column. The query then returns the count of “surviving” rows. Following the order of the statements, data(row) in the table is first filtered by the value of the StartTime column and then filtered by the value of the State column, and lastly, the count of “surviving” rows are returned.
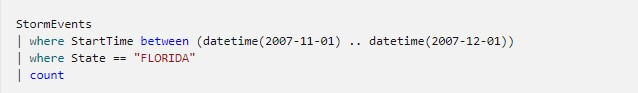
Source: Kusto Tutorial
Result for the above query:
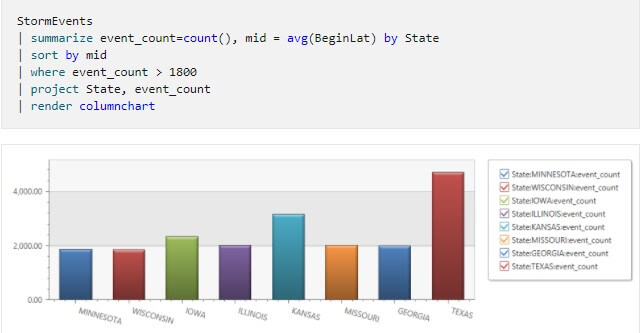
Source: Kusto Tutorial & Application Insights Documentation
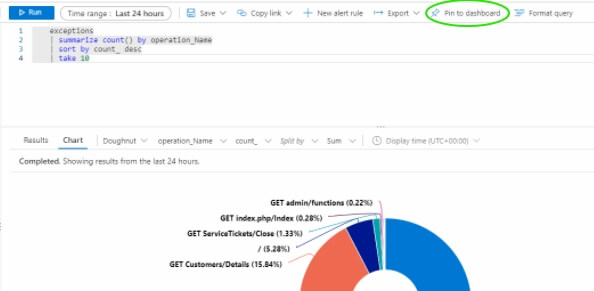
By selecting the pin icon at the top right of the query editor, the visualization of the result set can be pinned to a custom dashboard. Similarly, multiple visuals can be pinned to the same dashboard. In this way, all the pinned visuals or query results can be tracked at one place parallelly. Furthermore, the refresh rate is very high since a query runs behind these visuals. Also, all the visuals can be filtered on the same date range and parameters. The final customized dashboard will be published once it’s shared with the desired set of users using Azure role-based access control (Azure RBAC).
Users can be assigned roles at three different levels of scope – Subscription, Resource group, and Resource and Different roles can be assigned: owner, contributor, and reader. Users who are owners or contributors can list, view, create, modify, or delete dashboards. Readers can list and view dashboards but can’t alter or delete them. Users with reader access can make local edits to a published dashboard, such as when troubleshooting an issue, but they can’t publish those changes back to the server. Instead, they can make a private copy of the dashboard for themselves. The permissions assigned from the subscription can also be inherited down to the resource, i.e., admin access to the Azure subscription also grants admin access to the resource where the published dashboard is a resource. But if users with limited permissions to the subscription require higher permissions to the dashboard, a resource group of several dashboards or a single dashboard can be created, and permissions can be assigned to it.
Application insights also provide us with a pre-configured dashboard with features including Availability, Usage, Errors, Performance, and Alerts. This pre-configured dashboard can also be seen as a perfect example of the several dashboards that can be created and utilized.
Use Case of Log Analytics
Storing and analyzing log data can be very beneficial, as it provides useful information which can be utilized in different areas. Few such use cases are listed below:
- Health check and live monitoring: Continuous generation of logs, reporting the application’s status at any given moment, enabling a way to implement a structured tracking mechanism to track the application’s performance.
- Troubleshooting and Debugging: Alert configuration helps auto-detection of anomalies, application errors/failures, and pinpointing the area of concern to help debug the issue.
- Application security and compliance: Logs also provide information related to system configuration, change requests, client IP, and other security-related information, which helps keep the application safe from threats and under compliance.
- Business Analysis: Lots of invaluable insights can also be derived from logs related to user preference, process health, delivery SLA, and so on, helping businesses to achieve their goals and strategize better.
Why is Application Insights is preferred?
- Easy and Understandable UI.
- Alerts are easy to configure and customize with a set of rules.
- Provides default metrics and powerful analytical tools such as smart detection, Availability testing to help diagnose issues and track the live performance of the application and log data ingestion. Also, it detects certain performance anomalies automatically.
- Tracks and logs user sessions to analyze user journeys and understand the application’s pain points.
- Dashboarding is made easy with direct queries running behind the scenes.
Conclusion
Although Application Insights dashboards are very useful, they can only look back to the last 30 days of data. Thus the dashboards are primarily used to study the current situation of the applications. However, Application Insights can be very flexible in such cases as they can be connected to Power BI, where dashboards with a longer duration view can be created. Hence, log analytics is instrumental in monitoring applications, and measuring the productivity of the applications and application insights is a perfect tool for this.


