In this era, handling data is one of the key challenges organizations face worldwide. Irrespective of advanced data analytics capabilities, the first step is always the exploration part, where businesses need to understand, slice, and dice the data. This becomes the base for the next steps where advanced analytics come into the picture. Hence, the significance of doing exploratory data analysis is growing, and the challenges while performing Exploratory Data Analysis (EDA) with the large data volume are becoming more complex.
In one of our recent works for a leading technology firm, we performed EDA for around 5TB of data. We couldn’t proceed with Excel or any other BI tools because handling vast amounts of data is not feasible in such platforms. Hence we had to choose an alternate method. The one-line EDA libraries allow us to explore the data quickly. During this process, we explored some of the best-in-class one-line EDAs and finally figured out the best one that suited our requirements. This blog will take you through a few one-line EDAs used in various EDA use cases depending on the problem and data.
What is EDA?
Exploratory data analysis (EDA) is the first step in data science to investigate data sets without prior background. The ultimate goal of EDA is to understand what the data tells us by summarizing the main characteristics of data. Developed in the early 1970s by American mathematician John Tukey, EDA continues to be a widely used technique to understand the data.
Why do data scientists use EDA?
Here’s a truth that all data scientists need to accept – data comes with several flaws. For example, raw data may have missing outliers and duplicate values. So it is crucial to use EDA to perform graphical and non-graphical analysis to get unbiased and accurate results.
Non-Graphical Analysis includes:
- Describing data to analyze data types, min, max, mode, median, quartiles, and more
- Handling missing and duplicate data
- Outlier detection
- Understanding correlation between the variables
Graphical Analysis includes:
- Univariate Analysis
- Bivariate Analysis
- Multivariate Analysis
Performing EDA on TB data size involving graphical and non-graphical analysis needs several lines of code to be written and is time-consuming and challenging. Hence, we bring in one-line EDA libraries that perform all these tasks in a single line of code.
What is a one-line EDA?
One-line EDA is easy-to-use libraries that provide a better overview of data by quickly analyzing and generating detailed reports of the dataset, saving both time and effort.
Some of the one line EDA are:
- Sweetviz
- Autoviz
- Pandas Profiling
- D-tale
We started exploring the one-line EDA tools mentioned above, experimented with a small sample dataset on-premise, and gathered the reports.
Sweetviz
According to the Sweetviz documentation, “Sweetviz is an open-source Python library that generates beautiful, high-density visualizations to kickstart EDA (Exploratory Data Analysis) with just two lines of code. The output is a fully self-contained HTML application.”
pip install sweetviz

import sweetviz as sv

report = sv.analyse(dataframe)

report.show_html()
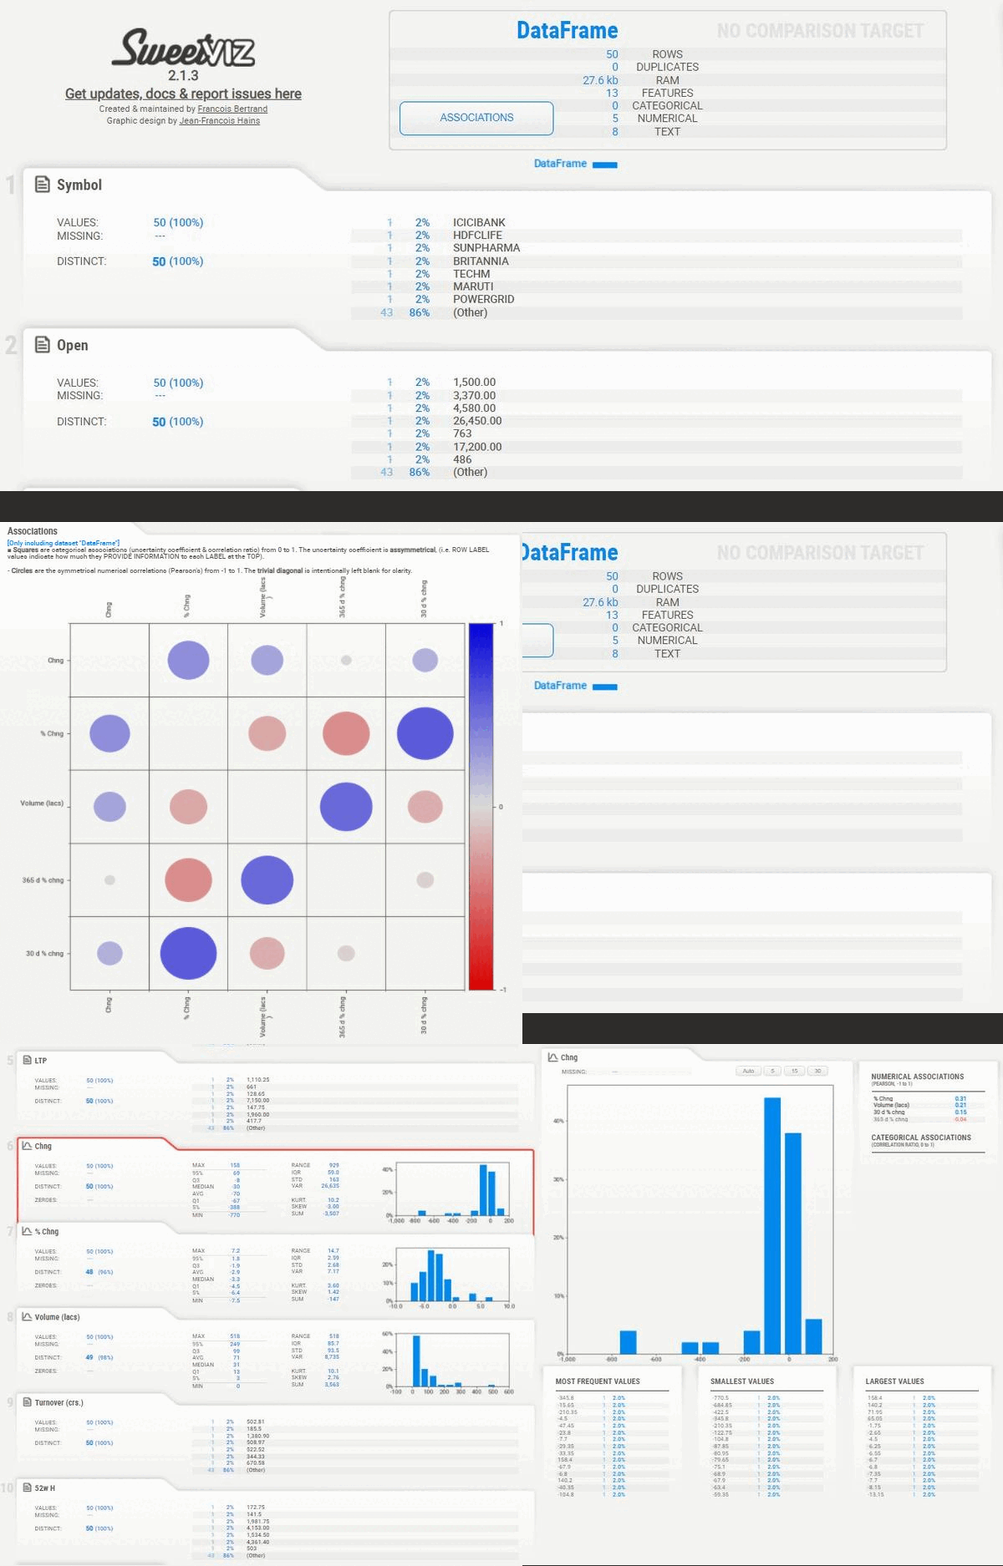
The generated report consists of:
- Description of the dataset as a whole
- Association between variables
- Summary of each variable with numerical analysis including min, max, mean, quartiles, number of missing values, distinct values

Autoviz
Autoviz is an open-source auto visualization library that Automatically Visualizes any dataset with a single line of code, generating the report in jpeg, png, or svg format.
pip install autoviz

from autoviz.AutoViz_Class import AutoViz_Class

AV=AutoViz_Class()

report=AV.AutoViz(dataframe)
The generated report consists of:
- Bar plots
- Distribution plots of categorical variables
- Heat maps
- Scatter plots
- Violin plots
Pandas profiling
The pandas df.describe() provides a generic view of the data but does not generate any detailed report. Comparatively, pandas_profiling extends the pandas DataFrame ability with df.profile_report() for quick data analysis and report generation.
pip install pandas-profiling

from pandas-profiling import ProfileReport

report = ProfileReport(dataframe)

report.to_file(output_file=’output.html’)
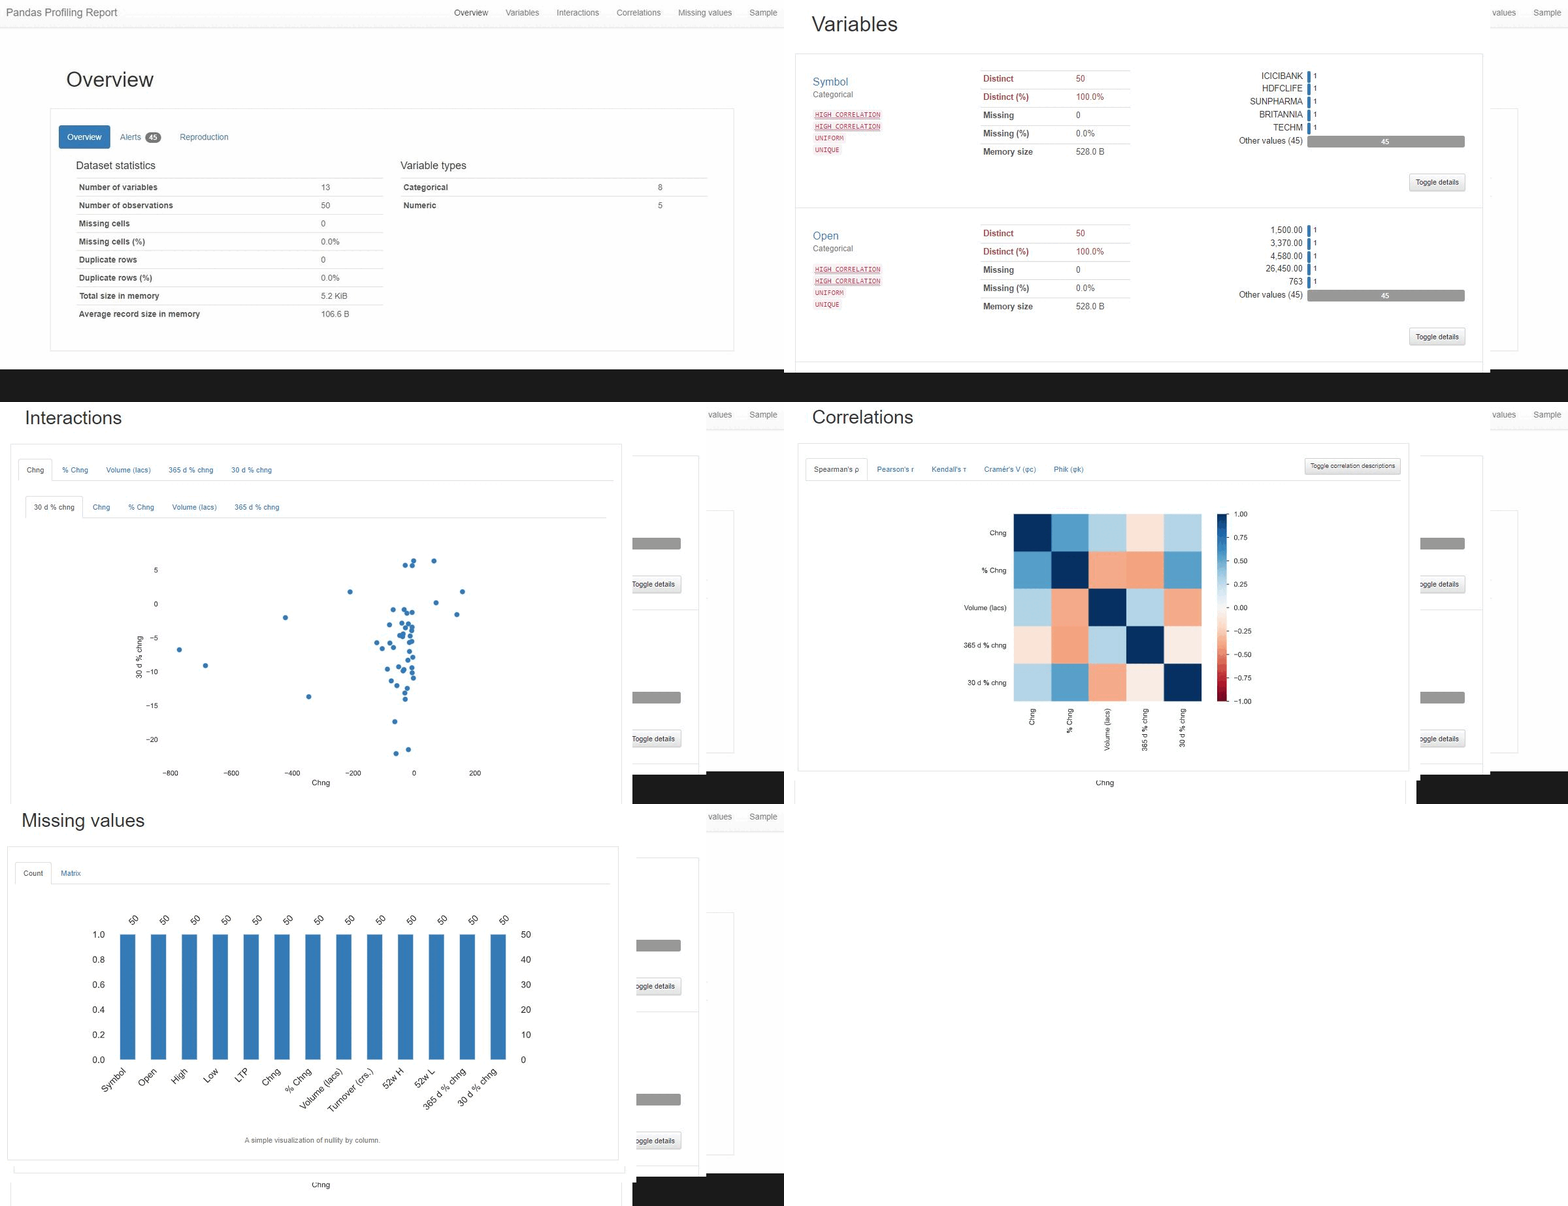
The generated result consists of:
- Overview of dataset like the number of variables, size of the dataset, number of duplicate rows along with its percentage
- Detailed analysis of each variable
- Correlations
- A report generated based on missing values

D-tale
Being the best in the business, D-tale is an open-source auto EDA library that generates user-friendly HTML reports of the dataset. Moreover, Dtale includes a unique feature of exporting code for every plot or analysis of our interest.
Pip install dtale

import dtale

dtale.show(dataframe)
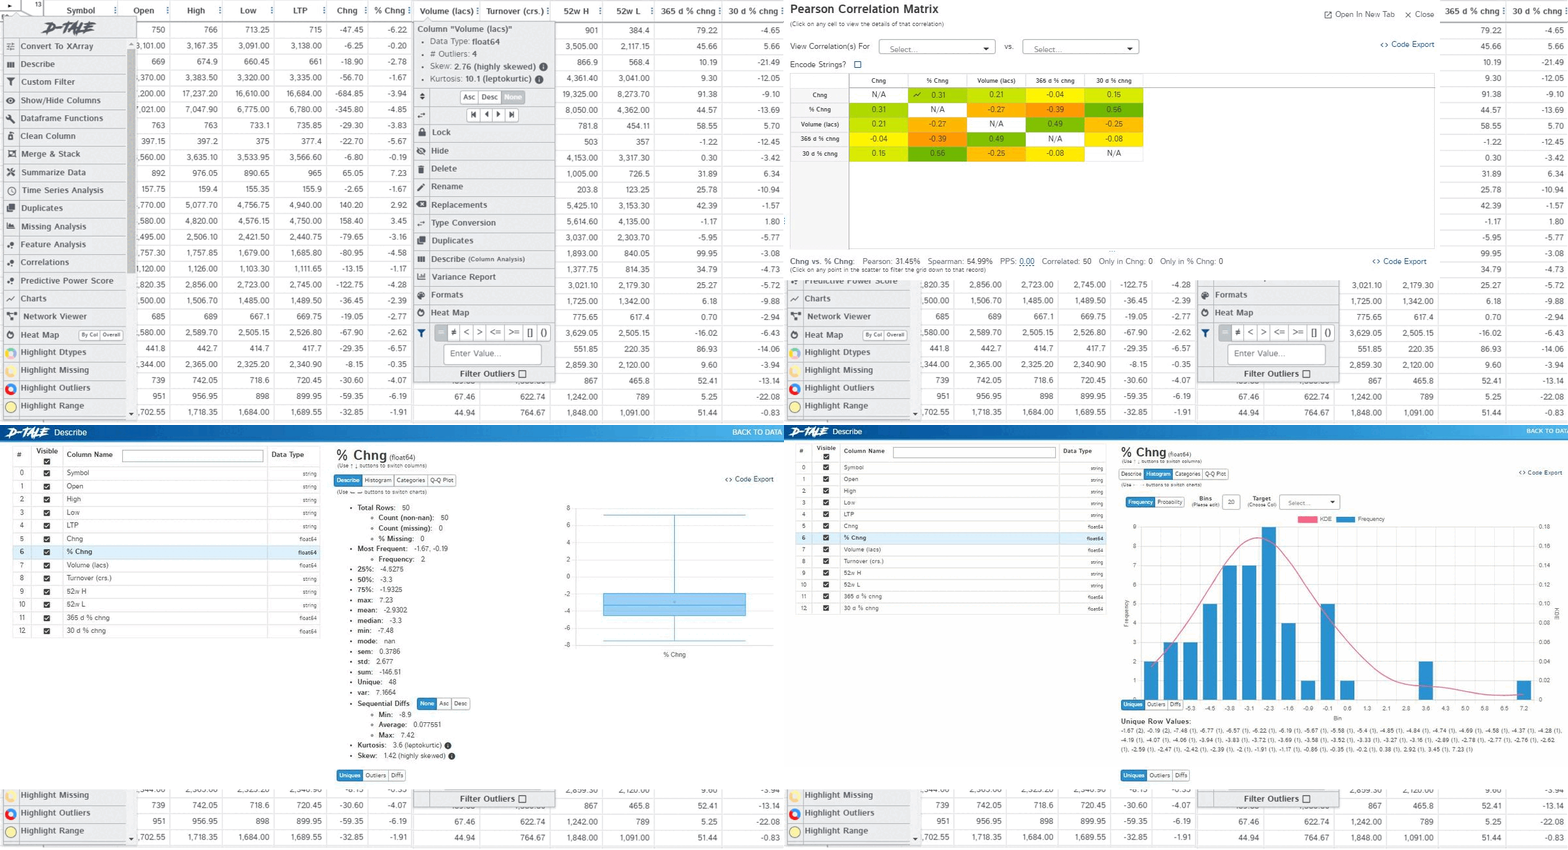
With the generated report, one can observe/perform the following:
- Detailed dataset description
- Play with each field separately (analyze the field, detect and remove outliers, rename the field, impute missing values, find and replace values)
- Feature analysis
- Correlation map
- Apply custom filters on the dataset
- Generate plots of our interest
- Exporting code

EDA on Databricks
On experimenting with these one-line EDA tools, we noticed that our requirement to try out 5 to 10 TB data could not be handled on-premise. It needed cloud service. So our exploration continued with Azure Databricks, which handle TB size data based on the core and cluster scalability.
Among these EDA tools, Dtale is better considering it’s less time-consuming, handles data efficiently, and performs well. Sweetviz and pandas profiling come a close second and third.
As Dtale cannot be used on Azure Databricks, we experimented with the following highest-performing tools, Sweetviz and pandas profiling. We gathered our analysis report based on time, cost, and configuration. Our experiment was based on various file sizes – we started with 655MB file size and went and went on to explore till 7GB file size. This process involves cluster configuration adjustment as the size gets increased.
We started with a Standard DS3_V2 cluster consisting of 14 GB memory and a four-core cluster size for 655MB data size. As the size increased to 4GB, we increased the cluster size to Standard DS8_V3, and for 7GB data size, we performed with a higher cluster size.
Based on the cluster configuration, only the DBU varied per hour and based on DBU per hour, the cost and time consumption was determined.
If the experiment fails due to the scalability and max size, it requires a cluster configuration change. We concluded that Sweetviz performs better than pandas profiling with a smaller configuration when experimenting with configuration changes.
Sweetviz is a better one-line EDA in the Azure Environment
- Both Sweetviz and pandas profiling perform well on Azure Databricks
- Time consumption-wise, Sweetviz plays well
- Cost-wise, Sweetviz performs better with less memory and VM usage compared to pandas profiling
- Based on the Analysis with 7 GB data and considering cost, time, and performance, Sweetviz performs better. Furthermore, we can also achieve EDA with TB size data by increasing cluster size.
Conclusion
Ensuring that the exploratory data analysis is done thoroughly will help understand the data and business more. In addition, this will open doors to data analysts and data scientists to pick up the underlying story, thereby performing the correct analysis and implementing the suitable form of advanced analytics that suits their business.
One-line EDA saves time and enables business stakeholders to draw insights and better plan their road map. All EDA tools have specializations, but picking the right one depends on the problem statement. For example, in the experiment explained in the blog, the need to scale up TB of data and provide good performance at the same time is achieved with EDA tools like Dtale, Sweetviz, and pandas profiling.
At LatentView Analytics, we have worked on multiple use cases similar to those discussed above, and we strongly believe these one-line EDAs will only improve from here. We have created a center of excellence and expertise exclusively in this area and have deployed dedicated resources. Starting from large Tech companies to CPG and Fintech firms, handling large data is a major challenge now, and the complexity will only increase. Data Engineering and EDA will be a strong foundation layer for analytics, and analytical firms will have a major role to play in this arena.


