


The blog post is a continuation of the previous one titled Inventory Holding Costs in Global, Connected Supply Chains which talks about inventory holding costs in the context of a retailer looking to trim inventory due to slowing consumer spending and shifting tastes that are a result of inflation and other external unforeseen factors. The previous blog also talks about the backdrop of challenges faced by different Retail Businesses (Retailers with a higher concentration of national brands vs private labels), establishing the importance of optimal inventory levels, systemic (connected) supply chain visibility and classifying inventory holding costs into segments to analyze cost factors more effectively.
Before we dive into the details of analyzing the cost segments of Inventory holding in this article, we want to summarize our findings on inventory holding costs from multiple secondary resources and competitors in the analytics and SAAS Industries. Multiple players categorize these costs differently. Some include purchasing costs as part of the overall “inventory costs” (but not inventory “holding” costs). Others include purchasing as part of the capital costs (one of the categories mentioned previously), which are part of inventory holding costs. Similarly, we also established inbound shipping costs as a grey area that some analytics providers include. It’s unlikely that these costs would be included under service, storage, or inventory risk, and are most likely to be included as part of material purchasing costs under capital costs. Another cost that some sources talk about is the expected outcome of risk on inventory costs. In case of a natural disaster or other unforeseen events, the expected outcome could be quite significant in terms of losses and damages. However, our understanding is that the cost of insurance protects against this uncertainty, and this is already accounted for under service costs. We believe, that the recovery time from a disaster is the biggest drawback from such a scenario, and not the cost associated with losses that are taken care of by the insurance component. That being said, we decided to create a solution that takes most of the above-mentioned grey areas into account through 2 features-
- We enabled a plug-and-play approach that allows the supply chain decision maker to pick and choose costs and cost categories based on business requirements to derive relevant cost savings and overall reductions to inventory holding costs.
- We also created a new adhoc category called “other” costs that enables the decision maker to add costs unaccounted for in the above categories based on specific business nuances to create a more customized business user experience and maximize cost savings across all components.
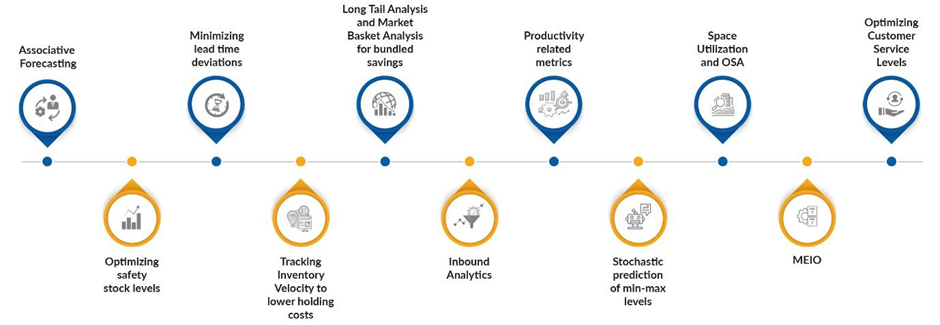
We can now dive into some solution frameworks and approaches that organizations can take across industries to minimize inventory-related holding costs.
- Associative Forecasting- Forecasting is one of the most talked about techniques used to plan for optimal inventory levels and avoid the additional costs that accrue with having the wrong products in stock and then facing an uphill challenge to trim products, recover costs, improve turnover and maximize profits.
- Optimizing safety stock levels- Reducing and optimizing safety stock levels is a good way to free up opportunity costs. It is recommended to have higher safety stock levels for select strategic and profitable products within product families/ segments with lesser near-shore sourcing options. This is done by segmenting products by inventory cycle time within each family and then classifying/ranking relative risk scores for products based on lead time, standard deviation of lead time, number of near-shore suppliers, and other supplier performance factors, therefore, deriving relative risk ranks for each of the products to warrant safety stocks with higher risk mitigation.
- Minimizing lead time deviations through supplier analytics and performance scorecards. The above related supplier analytics metrics can also be used in minimizing lead time deviations by allocating flexible sourcing routes, therefore minimizing the safety stock and overstocking levels needed to prevent against delivery defaults.
- Tracking Inventory Velocity to lower holding costs- Inventory velocity paints a picture of business performance in terms of stock needed for your day-to-day operations vs total stock available in inventory. Inventory velocity is another way of determining which product segments are overstocked or have excessive safety levels that can be trimmed to deliver lower costs.
- Long Tail Analysis and Market Basket Analysis for bundled savings- Long tail analysis helps identify slow-moving segments, and market basket analysis helps group products within and across these segments into bundles that have the highest probabilistic chance of purchase to maximize profits and minimize losses by markdowns.
- Inbound Analytics- Tracking metrics related to purchase orders received, GRN (Goods received note) putaways, and the accuracy and time related to these activities can really ensure that inbound targets are being met to avoid order delays, stock shortfalls and productivity bottlenecks, all of which contribute to increased costs.
- Productivity-related metrics- With retail companies facing slowing growth and cutting costs through restructuring, layoffs and hiring freezes, they face an uphill challenge to meet the demand that comes with the impending holiday season ahead. Productivity-related metrics in a DC/FC related to inbound operations, stock movements, and outbound processing, can help maximize labour utilization and efficiency, thus bringing down overall costs.
- Stochastic prediction of min-max levels- Using stochastic modelling to determine min and max levels for reordering products helps control and optimize profitability through all the factors that are “unknown” to demand variability and likely not explained by the more “controllable” factors that are captured through associative forecasting. This, in combination with forecasting, helps in optimizing inventory costs and profits for external and social factors that are both known and unknown.
- Space Utilization and OSA- Optimizing shelf space and OSA (On-shelf-availability) to drive sales are key approaches used to utilize space available while maximizing SPF (Sales per sqft). Maximizing sales naturally leads to better inventory velocity and turnover.
- MEIO (Multi Echelon Inventory Optimization) and allocation to drive down system costs and optimize inventory profitability across all levels in the network.
- Optimizing Customer Service Levels- Deriving optimal customer service levels as a composite metric that not only considers optimal stock availability/OSA but also delivery accuracy and delivery promise to ensure a customer-centric and connected approach to minimize systemic costs, maximize returns, improve customer lifecycle management and market share growth.
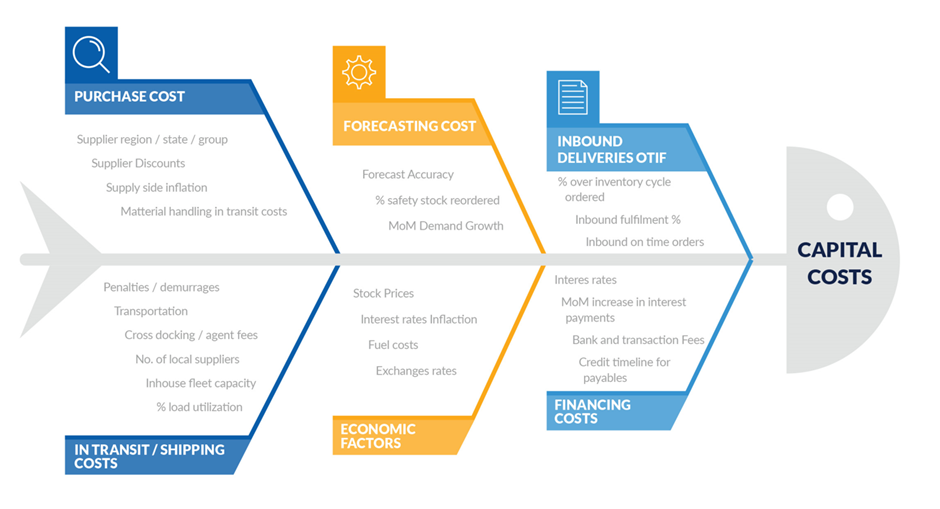
Before concluding this blog post, I wanted to choose one of the four components of inventory holding costs (capital costs) and give you a glimpse of how the LatentView Analytics’ supply chain team goes about identifying root cause drivers for this cost component. Once the causal drivers are identified, we work closely with the client to harness data points corresponding to these factors and run a variety of causal and predictive models to arrive at explainable real time solutions that are personalized to the persona of choice along the supply chain making decisions. We leave you with this fishbone diagram that considers some of the factors that contribute to capital costs and encourage you to get in touch with us to engage in a healthy conversation to unlock potential data-driven insights that can add value to your Business not only through short term cost savings but also long-term profitability in these challenging economic times.
References:
- https://www.wsj.com/articles/large-retailers-are-getting-hit-hardest-by-overstocking-11657312677#:~:text=The%20retail%20sector%27s%20ratio%20of,with%201.48%20in%20April%202019.
- https://www.wsj.com/articles/how-macys-has-avoidedso-farthe-inventory-pileup-plaguing-other-apparel-chains-11664930492
- https://quickbooks.intuit.com/r/midsize-business/carrying-costs/
- https://www.shipbob.com/blog/inventory-carrying-costs/
- https://www.shipbob.com/blog/inventory-cost/
- https://www.netsuite.com/portal/resource/articles/inventory-management/inventory-carrying-costs.shtml
- https://www.fountain9.com/resource/6-ways-to-save-inventory-cost-optimize-working-capital
- https://www.inventanalytics.com/blog/optimal-inventory-balance-to-reduce-inventory-and-lost-sales/
- https://www.fourkites.com/blogs/what-is-inventory-carrying-cost/
- https://fitsmallbusiness.com/inventory-carrying-cost/


