

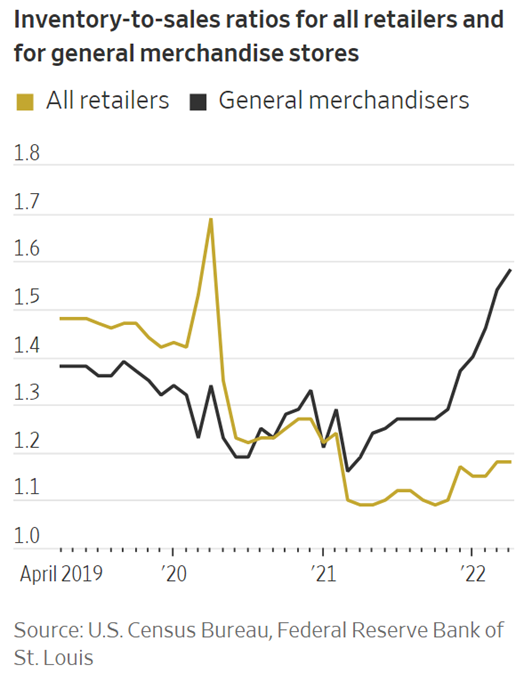
According to a recent article by the WSJ, the inventory-to-sales ratio for most big box retailers varied between 1.2 and 1.3 for a large part of 2020 and 2021. However, that ratio increased significantly in November 2021 and rose to 1.6 in April 2022. Businesses prefer a low inventory-to-sales ratio even though it can mean a higher risk of stockouts. Values ranging from 0.16-0.25 signify healthy inventory levels, but this could vary by industry. The rule of thumb is to benchmark against the industry average, but when the benchmark is off, there is a risk to overall industry growth and profitability.
Another article in October reported that Macy’s is doing better than some other retailers in terms of inventory levels, with inventory up by 7% compared to the same time last year. This number was closer to 48% for Kohl’s, 44% for Nike and 37% for GAP. Macy’s operates with more national brands than private labels, with private ones contributing less than 1/5th of total sales as modifying orders based on fast-changing consumer preferences is more practical to achieve when compared to Nike, Kohl’s or GAP, brands that fully control their products post-production, from the factory to the store or consumer. For instance, Kohl’s has close to 1/3rd of products listed as private labels, and had close to $269 million in merchandise in transit during the quarter that ended on July 30. These brands were unable to cancel orders for products their consumers did not want anymore. (The recent Sephora Partnership can contribute to some private-label goods in transit). Higher inventory levels result from a practice that retailers call a “Pack and hold” approach to store unsold seasonal products for another year before being brought back to the shelves.
It’s easy to identify inflation and changing consumer behaviour as the root causes for the recent and persistent slowing in demand. It’s even easier to blame the Fed for unfavourable interest rate hikes and all the geopolitical tension with Russia for the rising oil prices. But there is a bigger problem that needs to be addressed: the problem of a Disconnected Supply Chain. A Disconnected Supply Chain, in simple terms, is a supply chain that lacks connected visibility and optimized coordination between nodes that operate from the factory, all the way to a consumer. This means that each node in the supply chain makes decisions without having an awareness of the impact of the decision on the other areas of the supply chain. For instance, not having the right inventory in a given location can be the result of supply bottlenecks at the manufacturer that the store manager was completely unaware of while waiting to receive an order or production decisions made by the supplier that resulted in unforeseen delays and decisions that were again unknown to the nodes next in line in the supply chain. Inventory imbalances can also be the consequence of the bullwhip effect- which is usually the result of a retailer not having end-to-end consumer demand visibility for the manufacturers and distribution centres to gauge actual demand accurately. Lack of visibility causes a domino effect that compounds variations in supply order quantities from each node all the way back to the supplier. These variations in replenishment order quantities are likely inflicted by different inventory levels and forecasting techniques used by the nodes in between the customer and manufacturer/DC in a supply chain. These are just a couple of examples of disconnected and poorly coordinated supply chains.
During the initial days of the pandemic, supply chains suffered just the opposite outcome compared to today’s overstocking situation. Retailers faced an unprecedented level of stockouts. The problem back then was seemingly attributed to the apparent effects of supply and shipping bottlenecks imposed by the pandemic. But again, optimal customer service levels are almost always a consequence of a connected supply chain. At LatentView Analytics, we create the art of possible by delivering optimal availability at all times through supply chain and socio-economic uncertainties to help build a resilient supply chain using connected data analytics across the end-to-end supply chain by identifying risks and opportunities before they occur. Optimal Customer Service level is the north star metric that we aim to solve at each node in the supply chain and optimal stock availability is a key underlying component that drives this metric at a given node. Our Supply Chain Analytics Solution- The ConnectedView offers a highly customizable and scalable set of accelerators (analytical frameworks) that reinforce and continually improve underlying KPIs such as optimal stock availability and other best practices at each node in the supply chain all while contributing to deliver the optimal CSL (To the customer next in line in the Supply Chain). The optimal performance levels at each node are also further maximized through overall systemic improvements (KPIs and practices) in the previous and next nodes in the supply chain as a result of the connected architecture of the solution. This triggers a chain of systemic improvements and enables companies to transform supply chain best practices from operating in silos to operating with a connected view.
Our solution not only solves optimal service levels and long-term profitability but also focuses on mitigating the subject of interest in this blog as a consequence- Supply chain costs, and more specifically, inventory holding costs which form a significant part of the costs incurred by a company in achieving desired service levels. Though most analytical solutions in the market focus on lowering costs by default, our dual benefits approach ensures that we help retailers and businesses mitigate short-term challenges relevant to changing market dynamics while ensuring long-term profitability through optimal CSL metrics. Currently, supply chain and inventory costs are prevalent short-term bottlenecks across industries. A good benchmark for inventory holding costs is estimated to be around 15-30% of the total inventory value (costs) at any given time. Multiple consulting, SAAS and analytics providers have slightly varied approaches in defining these costs, but most segment these costs into 4 broad areas- Capital, Service, Storage and Inventory risk. These costs are derived based on the time of analysis and include the following-
- Capital costs include costs associated with purchasing, financing and interest rates on loans for purchasing.
- Service costs include investments in software, hardware, tax, insurance, personnel costs to handle these services etc.
- Storage costs cover factors like rent, overheads, opportunity costs for storage and safety inventory levels.
- Inventory risk costs account for obsolescence, shrinkage, and the expected outcome for the risk of inventory damage through unforeseen events.
- Other costs not limited to the above areas may include shipping, administrative, material handling equipment, other salaries, opportunity costs associated with delayed lead time and delayed innovation, and other costs not mentioned in the above 4 buckets.
- An example representation of the inventory holding costs for a retailer is depicted below-
Example problem: As the end of fall approaches for a US-based retailer, the recent inflation trend has resulted in slower spending and rising inventory levels. Consumers are switching to outgoing fashion segments as they adopt new social trends while spending less on discretionary segments like electronics and home goods. As the prices of essential categories like food, medicine, transport, and insurance continue to escalate significantly, the retailer is left pondering inventory imbalances and wants to trim slow-moving segments to bring in innovative winter wear to match changing trends and seasonal requirements. The retailer wants to cut costs to reallocate resources with sales slowing down and therefore wants to analyse the category of costs that contributes the most to overall inventory holding costs. Looking at the calculations below, the retailer seems to have an unhealthy level of inventory costs, with the preferred range being 15-30% based on industry practices, with storage and opportunity costs contributing the most to the overall costs, at around 54% of the total inventory holding costs. Follow our LinkedIn page for updates about our upcoming blog post, “ConnectedView Analytics frameworks that reduce inventory holding costs”, which focuses on multiple ways a retailer can reduce these costs through underlying causal analytics.
References
- https://www.wsj.com/articles/large-retailers-are-getting-hit-hardest-by-overstocking-11657312677#:~:text=The%20retail%20sector%27s%20ratio%20of,with%201.48%20in%20April%202019.
- https://www.wsj.com/articles/how-macys-has-avoidedso-farthe-inventory-pileup-plaguing-other-apparel-chains-11664930492
- https://quickbooks.intuit.com/r/midsize-business/carrying-costs/
- https://www.shipbob.com/blog/inventory-carrying-costs/
- https://www.shipbob.com/blog/inventory-cost/
- https://www.netsuite.com/portal/resource/articles/inventory-management/inventory-carrying-costs.shtml
- https://www.fountain9.com/resource/6-ways-to-save-inventory-cost-optimize-working-capital
- https://www.inventanalytics.com/blog/optimal-inventory-balance-to-reduce-inventory-and-lost-sales/
- https://www.fourkites.com/blogs/what-is-inventory-carrying-cost/
- https://fitsmallbusiness.com/inventory-carrying-cost/


