


In today’s world of limitless connectivity, multiple devices, unlimited choices, several individual personas, there is something sublime unifying all of the above. There is an invisible thread connecting all the dots despite the digital growth happening every day. According to the Chaos Theory, something as small as the flutter of a butterfly’s wing can ultimately cause a typhoon halfway around the world.
In other words, we are a part of a network in all stages of our lives, be it a social network like friends or family, an organization network like an educational institution or workplace. The networks we are a part of also include a social media network where we connect with people across the world or even a consumer network as users of various brands. Thus, networks are all around us.
The concept of networks and extracting information has untapped potential, be it a social setting, consumer behavior, health management, education, politics. Though intellectuals have started seeing the benefits of identifying social groups for various applications, this concept has not become mainstream in the business world. This blog delves into SNA (Social Network Analysis) and how it can be used to analyze and solve business-related problems.
What is SNA?
Social Network Analysis (SNA), also known as network science, is a general study of the social network utilizing network and graph theory concepts. It explores the behavior of individuals at the micro-level, their relationships (social structure) at the macro level, and the connection between the two.
SNA uses several methods and tools to study the relationships, interactions, and communications in a network. This study is key to procedures and initiatives involving problem-solving, administration, and operations of that network.
The basic entities required for building a network are nodes and the edges connecting the nodes. Let us try and understand this with the help of a most common application of SNA, the Internet. Webpages are often linked to other web pages on their own page or other pages. In SNA language, these pages are nodes, and the links between the pages are the edges. In this way, we can interpret the entire internet as one large graph.
SNA is a commonly used approach for analyzing interpersonal connections on the internet due to the boom of social media networking. But this concept is not limited to online social networks; it can be used for any application that can be modeled as a network.
A Guide to the Most Used SNA Terminologies
As established earlier, nodes and edges are the building blocks for SNA. Few characteristics of the edges that define the features of a network are shown below.
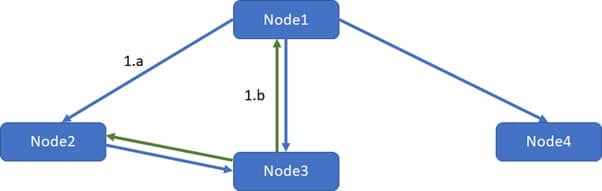
The Edges connect the Nodes. The direction of connections determines the Edge type.
1.a Directed Edge: The nodes connected by this edge are ordered, that is, the connection between the nodes is one way. For example, Twitter, Instagram are predominantly directed edge networks. You can follow someone without them following you back.
1.b Undirected Edge: The relationship between the nodes connected by this edge is mutual, i.e., the connection is applicable both ways. E.g., Befriending a person on Facebook, LinkedIn automatically creates a two-way connection.
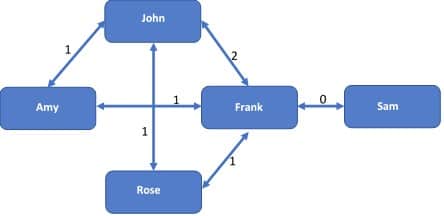
2. Weight: In a weighted network, an edge carries a label (weight) between the nodes. Different applications can have their own definition of weight. In social media analysis, a weight can define the number of mutual connections between the nodes connected by that edge.
In Figure 2, John and Frank have two mutual friends, Rose and Amy. Thus, the edge connecting John and Frank carries a weight of 2.
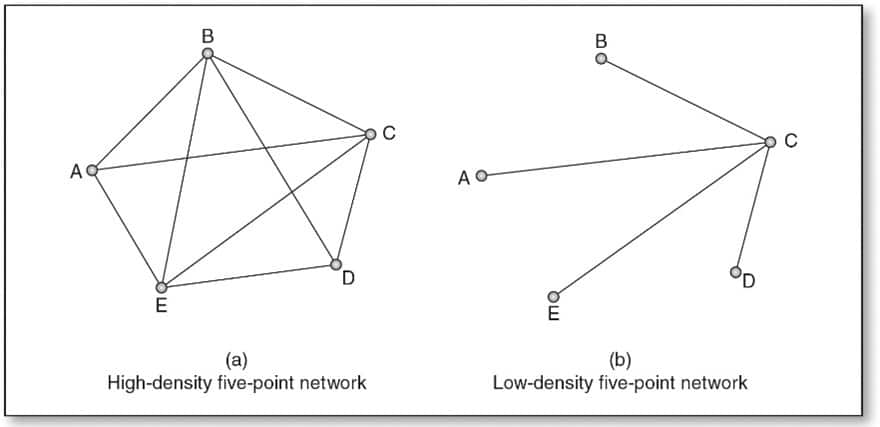
3. Density: The relation between the number of existing connections in a network and all possible connections in the network is calculated as follows:
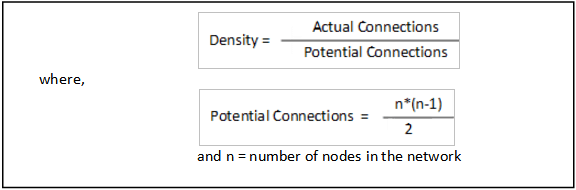
In Figure 3, we have a five-point/node network. The total possible connections in this network are 10. Figure 3.a has nine edges; its density is 90%. Hence it is a high-density network. Whereas Figure 3.b has only four edges, it has a low density of 40%.
Centrality Measures:
a) Degree Centrality: Measures the number of direct ties to a node; this will indicate the most connected node in the group.
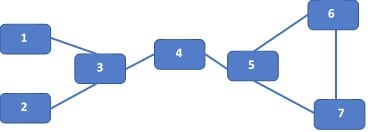
Let’s consider the network in Figure 4. The degree centrality score of a network is the sum of edges connected to that node. For Node 1, the degree centrality is 1, and for Nodes 3 and 5, the score is 3.
The standardized score is calculated by dividing the score by (n-1), where n is the number of nodes in the network.
We can see that nodes 3 and 5 have a high degree centrality of 0.5, i.e., they are the most well-connected nodes in the network.
b) Closeness Centrality: Closeness measures how close a node is to the rest of the network. It is the ability of the node to reach the other nodes in the network. It is calculated as the inverse of the sum of the distance between a node and other nodes in the network.
Let us take node 1 from Figure 4; the sum of distances from node 1 to all other nodes is 16.
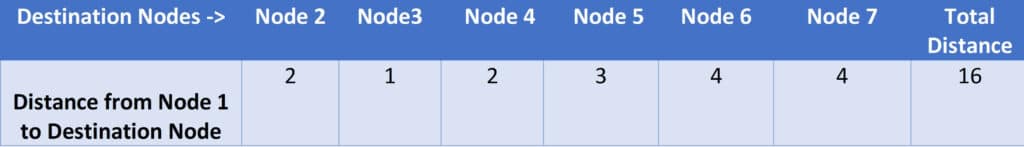
Hence the Closeness score for node 1 will be 1/16. The standardized score is calculated by multiplying the score by (n-1).
We can conclude that node 4 is the closest/central node in the network with the highest closeness score of 0.6.
c) Betweenness Centrality: It is a measure of how often a node appears in the shortest path connecting two other nodes. Let us take node 5 in Figure 4. Node 5 occurs in 9 shortest paths between a pair of nodes (as shown in Table 4).
If node 5 is the only node in the path, then the path value is 1. If it is one of the ‘n’ nodes in the shortest path, then the path value is 1/n. The sum of path values for node 5 for all nine pairs of nodes is its betweenness score. These values are then standardized by dividing the score by (n-1)*(n-2)/2
Nodes with high betweenness centrality are critical in controlling and maintaining flow in the network; hence these are critical nodes in the network
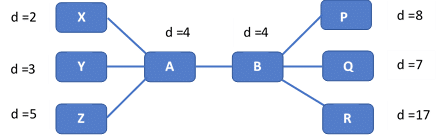
.d) Eigenvector Centrality: A relative measure of the importance of the node in the network. Each node is assigned a value or score depending upon the number of other prominent/ high scoring nodes it is connected to.
Why do we need such a relative measure? Consider the network in Figure 5. Here ‘d’ represents the degree centrality score. Nodes A and B are connected to 4 nodes each, and hence both have a degree centrality score of 4. But when we look at their neighbors, we can see that node B is connected to nodes with a high degree. Hence, node B can be preferred over node A when we have to choose based on connectivity.
Real-world use cases of Social Network Analysis:
1. Supply Chain Management: A supply chain can be modeled into a network of supplier/consumer relations. Network analysis on the supply chain helps us improve the operation efficiency by identifying and eliminating less important nodes (suppliers/warehouses). It can help identify crucial nodes in the network and create a standby in crises or emergencies.
Nodes include Retailers, Suppliers, Warehouses, Transporters, Regulatory agencies.
SNA applications can help manufacturers identify more operationally critical nodes and identify potential sources to increase the number of connections to suppliers. This can also help identify any bottlenecks in the supply process and inventory management.
2. Human Resources:
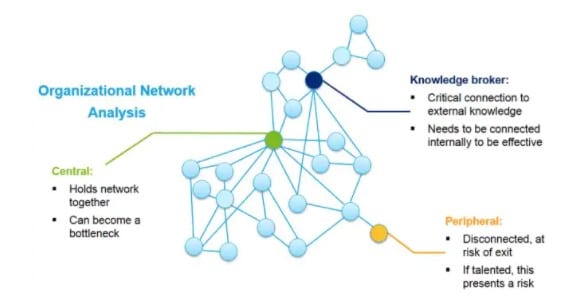
HRM often strives to identify critical resources and understand their contribution to the organization flow, collaboration, participation, and information flow. By following the Organizational Network Analysis (ONA), an organization will optimize the talent connections, productivity, and utilization.
It will also help identify the reach of an individual, identify accelerators of growth and poorly connected resources, and decide whom to give more opportunity.
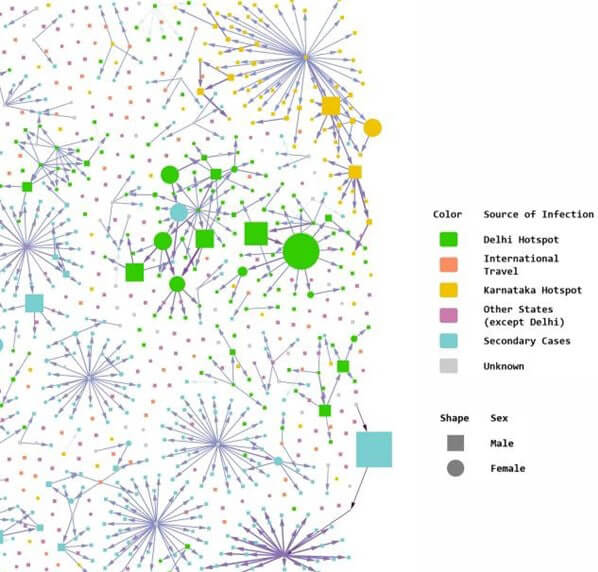
3. Transmission of Infectious Diseases: SNA could help identify and isolate individuals and groups with high betweenness and out-degree centrality (transmitters of disease) and implement sound contact tracing activities to mellow the impact.
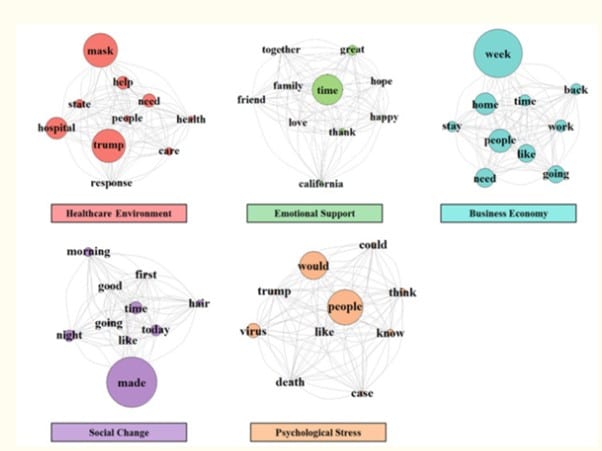
Apart from Contact tracing, SNA can also identify dominant themes and relations between keywords and identify the sentiment. Here is the connection between the top 10 words for COVID-19 themes:
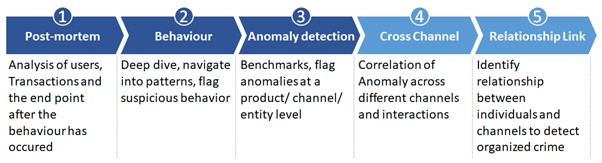
4. Finance, Fraud detection: Financial organizations can use SNA for fraud detection. Fraud is often organized by groups of people loosely connected to each other. Such a network mapping will enable financial institutions to identify customers who may have relations to individuals or organizations on their criminal watchlist (network) and take precautionary measures.
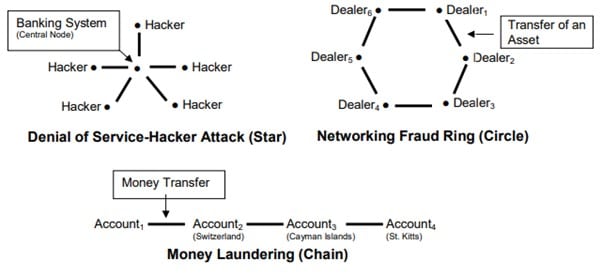
SNA can also be used to deny access to potential hacking networks, identify a fraud ring, and series of money transactions that could be linked to Money Laundering activities.
As a Business Leader, you will have to make many critical decisions regarding effective employee performance, supply chain management, and eliminating bottlenecks in an operation process, contact tracking, credit risks, and several other use cases. SNA has immense potential to elevate existing analysis, given there is information flow and connections.
Get in touch with us or mail us at marketing@latentview.com to know how SNA can be applied to add value to your business.
References:
- https://towardsdatascience.com/how-to-get-started-with-social-network-analysis-6d527685d374
- https://www.sciencedirect.com/science/article/pii/S2212017315001528
- https://bmcmedresmethodol.biomedcentral.com/articles/10.1186/s12874-020-01119-3
- https://www.cgi.com/sites/default/files/white-papers/Implementing-social-network-analysis-for-fraud-prevention.pdf
- https://www.mphasis.com/content/dam/mphasis-com/global/en/nextlabs/resources/home/whitepapers/Social-Network-Analytics-for-Fraud-Detection.pdf


