


The global asset management industry has been steadily expanding and witnessing transformations brought about by the recent fundamental shift in technology and global finance. Both the increase in the number of high net worth clients across countries, and the rapid expansion of the retirement market have contributed to the volume of the industry’s operations. According to Wills Towers Watson, a global financial advisory firm, the total assets under management swelled by 5.8 percent to $81.2 trillion at the end of 2016. Asset management firms are at a turning point as artificial intelligence and advanced analytics open new avenues.
The remarkably rapid progress in technology in the last two decades has significantly improved the way industry professionals store and process data. Traditional data-processing application software have given way to newer analytical applications which are adequate to deal with ‘big data.’ The cost of collecting and processing stock market data across industries has consequently reduced, opening new possibilities for improving decision-making mechanisms across verticals. The asset management industry has been no exception to this trend, with analytics revolutionising the problem-solving paradigms of this trillion-dollar business. Gartner, in a study conducted in 2017, reported that growing adoption of artificial intelligence, automation technologies such as robotic process automation, and open application programming interfaces (APIs) offer asset management firms dramatic opportunities to gain competitive advantage.
Application of Analytics in Asset Management
Analytics can be instrumental in reforming the functioning of some of the dimensions of this industry. The major highlights of the aforesaid analytics-driven recasting may include the following:
Client Profiling: Client profiling is a crucial process through which asset managers create descriptive segments of the clients being served. Each segment is defined by specific characteristics that enables asset managers to better understand their clients. They can win customer loyalty by providing highly personalized offerings, services, and insights based on their individual preferences and aspirations. Such a clustering exercise provides insights into client investment behaviour, thereby helping build a roadmap to create and measure value.
Product Recommendations: Asset managers use highly specific investor insights to develop new products and pricing strategies to target potential investors. Providing product recommendations based on customer interests boosts reach and engagement with potential clients, thus improving campaign efficiency.
Customer Churn: Disinvestment can potentially disrupt market trends significantly among institutional investors. Forecasting customer churn enables asset managers to manoeuvre client risk and intervene early, if necessary. Firms can also build robust portfolios by understanding the drivers of disinvestment.
Sentiment Analysis: Sentiment analysis provides insights into an asset management firm’s brand perception, product placement, and the factors that drive the two. A thorough analysis helps firms to widen your marketing reach through sponsorships and other events.
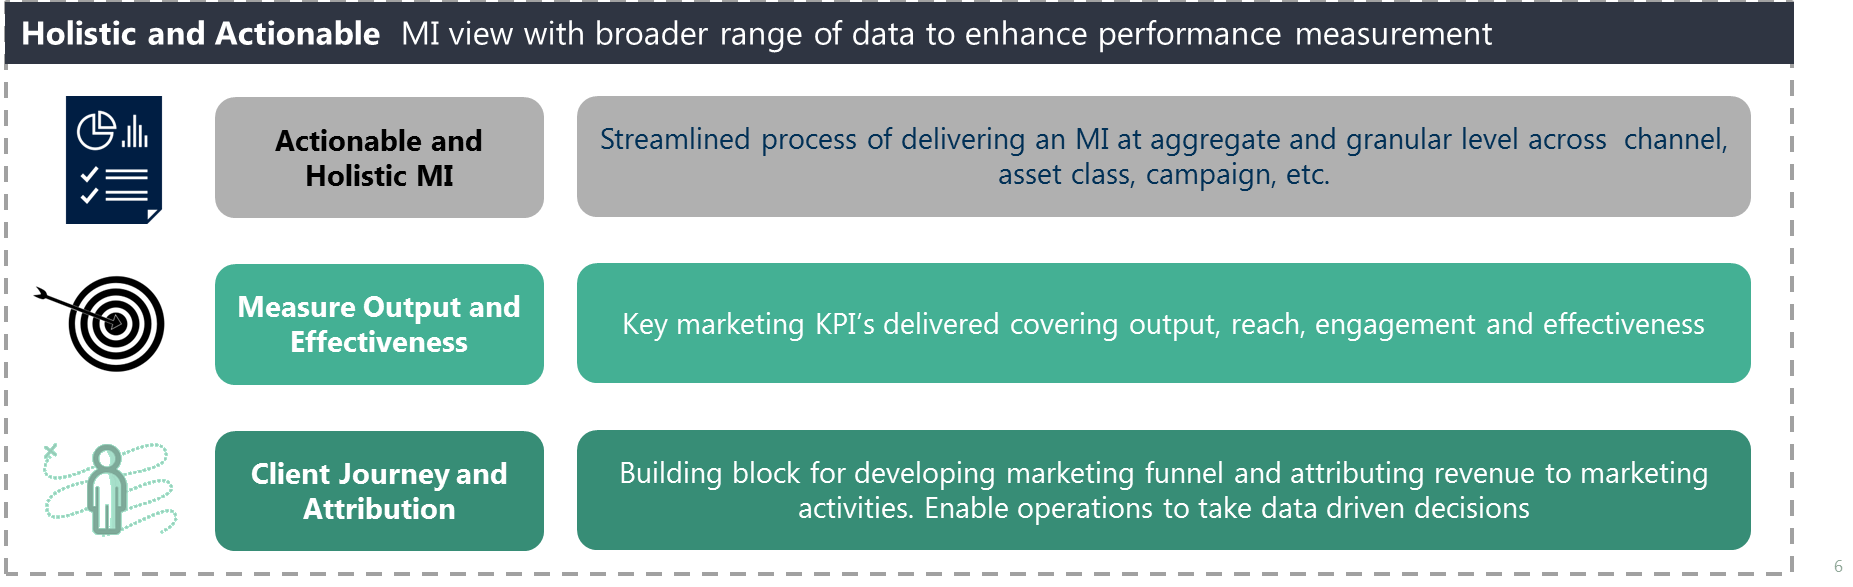
Marketing and Strategy: Tracking and mapping marketing activity is important for managers to effectively utilize the firm’s resources.
Case Study: Customer Retention Model
Problem Statement:
The main objectives of building a customer retention model are to identify:
- Active clients who are likely to disinvest
- Driving factors behind disinvestment
Since clients invest through mandates, which can often be more than one, the target was redefined to take into account mandate risk rather than client risk.
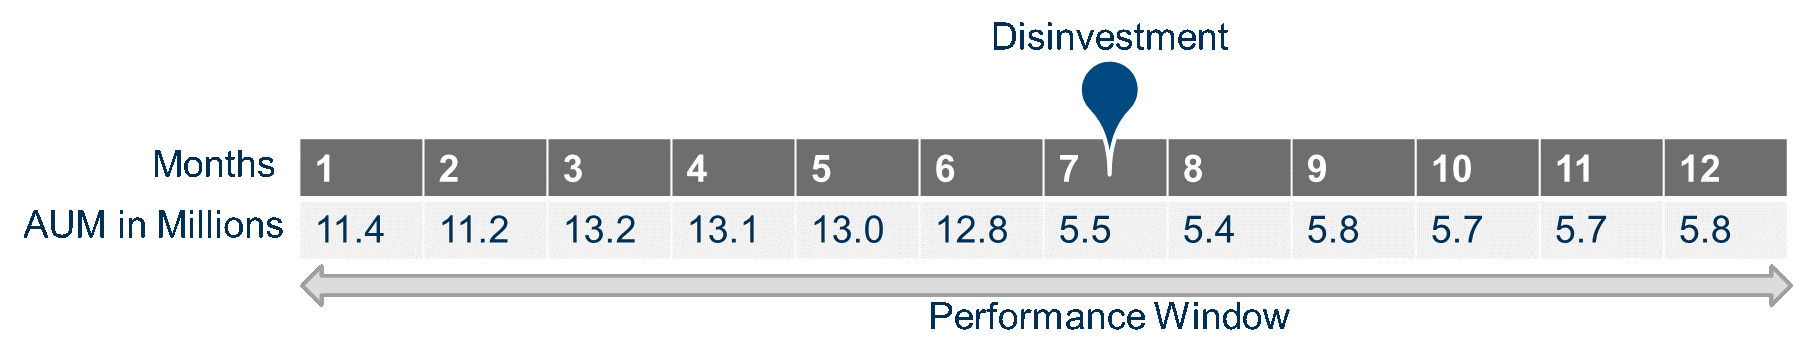
Understanding Disinvestment: An event is said to occur if a mandate’s assets under management (AUM) reduces by over 50 per cent in 12 months following the observation month.
Let us consider a mandate ABC with an AUM of 11.4 million. If the AUM of the mandate decreases to 50 percent or less than its value at point ‘X’, then it is considered as ‘Disinvestment’.
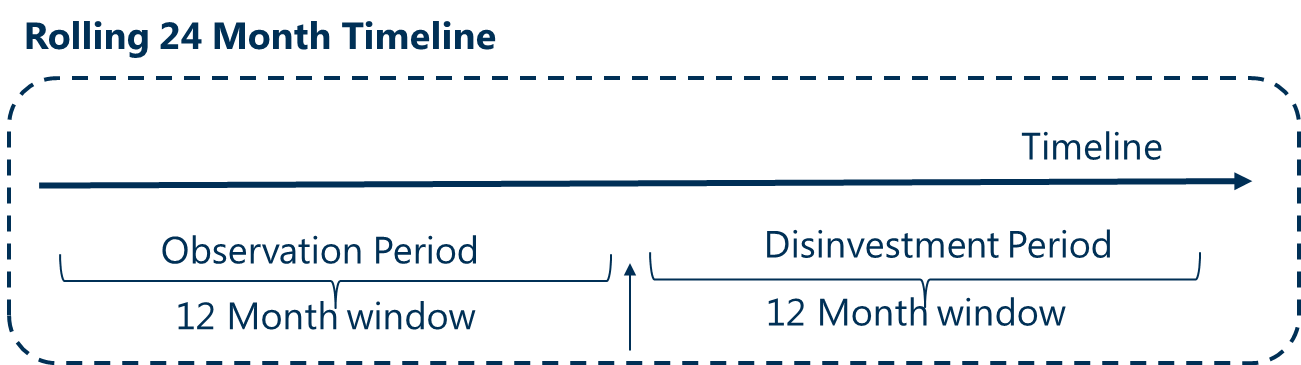
Addressing Complexity in Data: Use of traditional techniques such as time series analysis and regression were not adequate to analyze disinvestment due to the lack of data points. This problem is addressed by aggregating the data for a 12-month timeframe to predict the probability of disinvestment in the next 12 months from the observation point.
Data Considered: There are broadly four variables to consider while understanding disinvestment:

Data Model:
Models are constructed to estimate the risk score for each mandate using disinvestment indicator as the dependent variable (DV) and the prepared factors as the independent variables (IDVs).
The prepared data is split into training and validation sets as depicted in the figure below: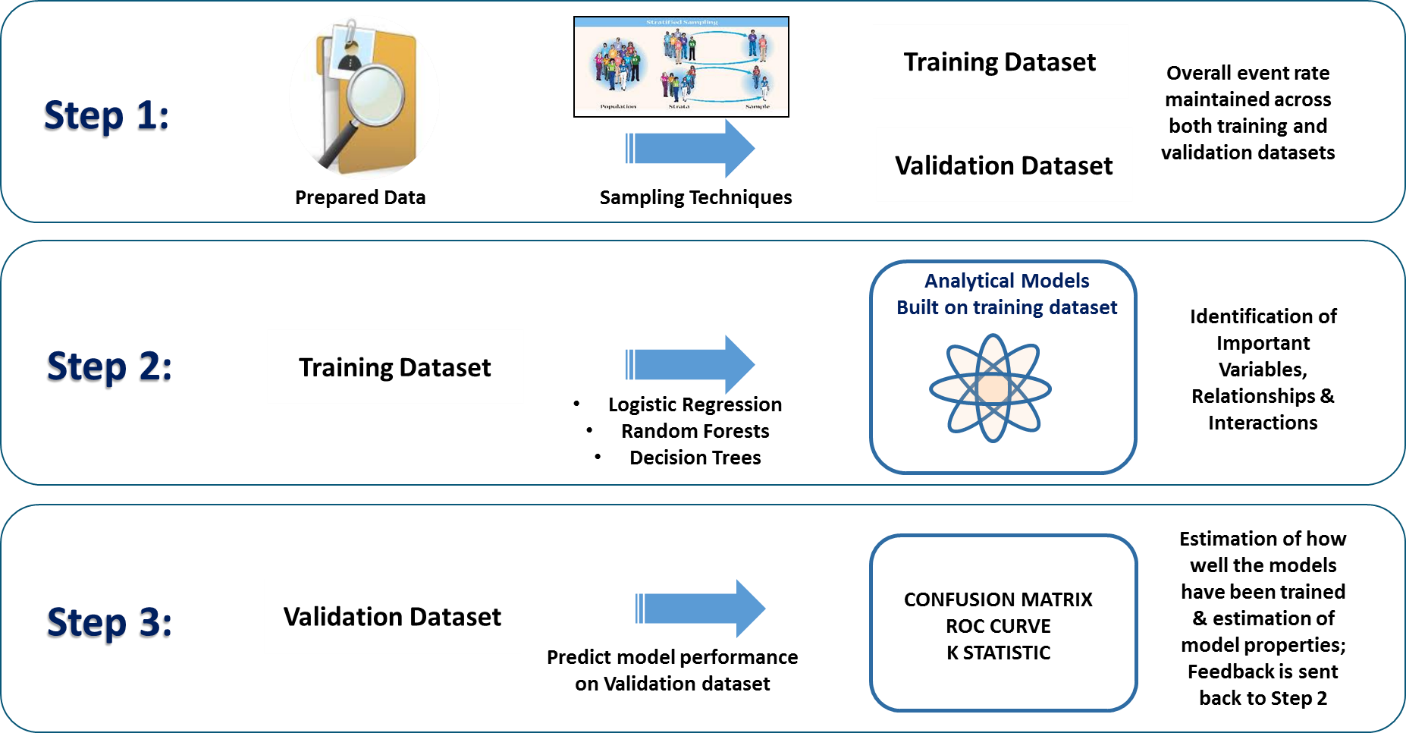
Extreme Gradient Boosting technique was found to have higher precision and yielded better results among the techniques used predict disinvestment patterns.
Model Validation Techniques:
There are many ways to validate or verify the quality of predictions. The following are some commonly used model validation techniques:
K-fold Cross Validation: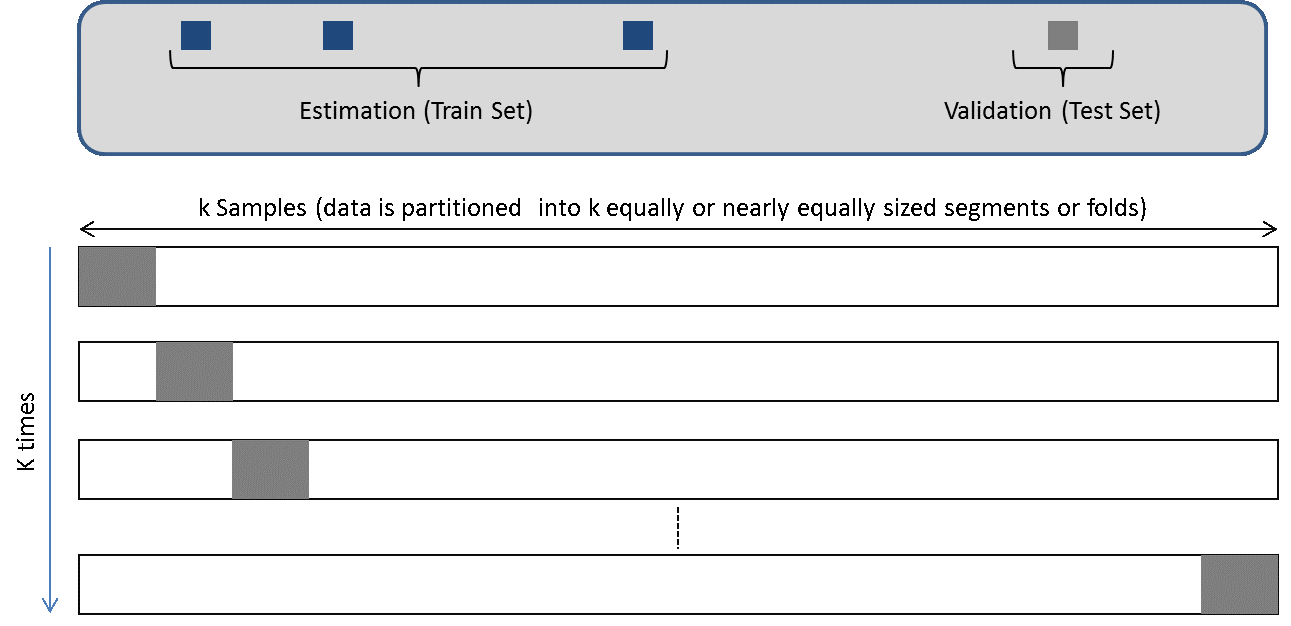
Leave Out One Cross Validation (LOOCV):
Bootstrapping: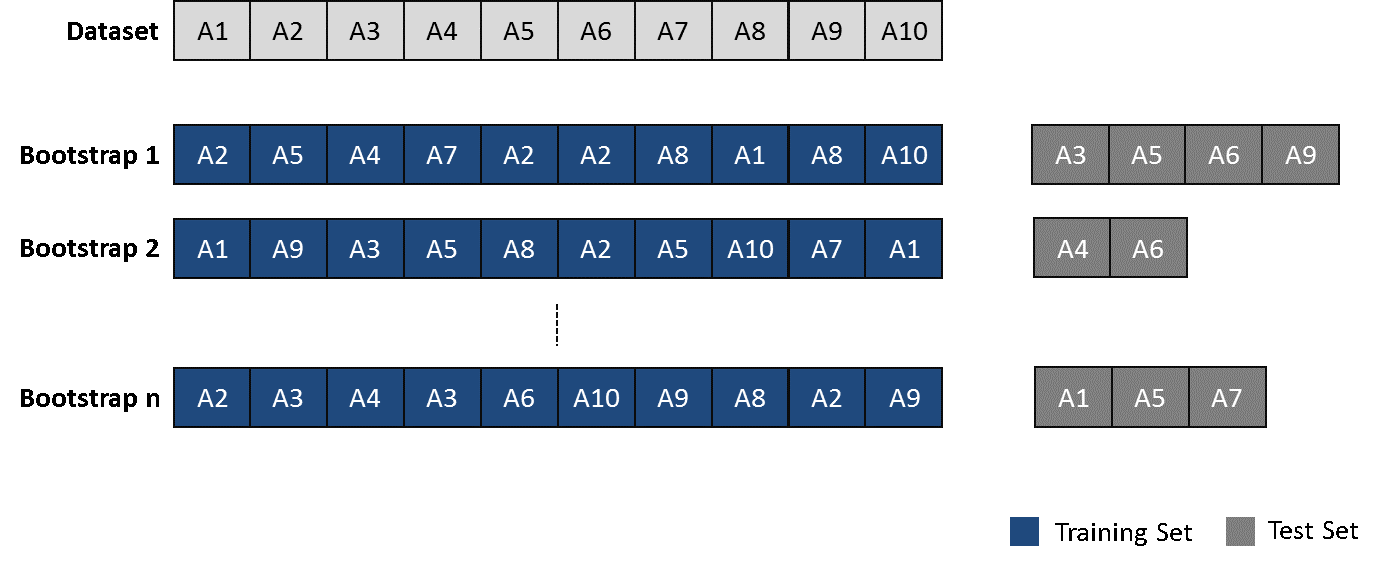
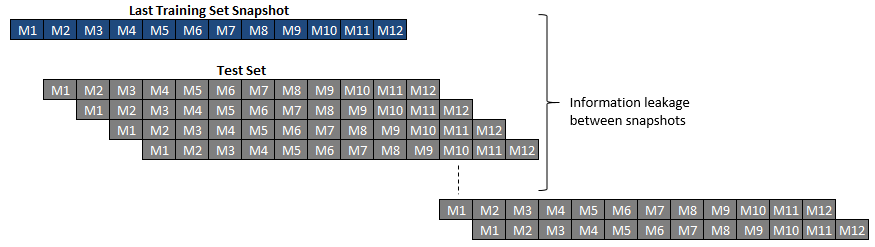
Applicability of Validation Techniques to the Business Problem: The problem at hand required a windowed approach to viewing relevant data points. As a result, every successive snapshot has a ten-month overlap with the preceding snapshot. This was true even for the overlap between the last training snapshots at the first test snapshot. This overlap gradually decreased over the next six snapshots. As a result, there were common data points between the model’s training and test sets. This information leakage between the train and test sets complicated the process of measuring robustness through simple cross validation. This was resolved by using out of sample bootstrap testing.
To solve the problem of information leakage, we set aside certain records and trained the remaining data. This process was repeated a certain number of times and robustness parameters were calculated and compared between samples. Since the performance was found to be consistently high, it was established that the model was robust.
In summary, asset management firms that embrace digital disruption quickly and strategically will be in the best position to deliver superior returns to investors. Today, though, new digitally enabled techniques challenge that status quo and threaten the stability of businesses that adhere strictly to traditional methods. Technologies such as machine learning, artificial intelligence (AI), natural language processing, and predictive reasoning let fast-moving firms and financial technology providers answer questions and model scenarios that push the boundaries of traditional analytics, delivering targeted insights that address a multitude of investment variables with unprecedented precision and speed. In many cases, comprehensive analyses that might otherwise take weeks are now achievable within hours.
Help your business realise the promise of advanced analytics
LatentView Analytics is working with companies across industries to harness the power of advanced analytics, AI & ML to transform their business processes, drive innovation and enhance customer experience. To know how LatentView Analytics can help you plan for AI and leverage its potential within your business, please get in touch with us at marketing@latentview.com


