


“Without the hard little bits of marble which are called ‘facts’ or ‘data’ one cannot compose a mosaic; what matters, however, are not so much the individual bits, but the successive patterns into which you arrange them, then break them up and rearrange them.”
— Arthur Koestler
There are plenty of instances of what data science is capable of. In other words, the applications of data science are practically endless. If you are an investor, you are probably aware of how vast chunks of data are generated daily in the financial markets. That’s where data science comes in.
With data science, we can perform analyses and provide recommendations that allow traders to make informed decisions on buying, selling, or determining the right makeup of a trading portfolio to meet specific financial goals or objectives based on a set period. This blog discusses practical applications of data science in stock market trading.
Data Analytics and Trading
Before diving into how data analytics is used in the stock market, let us start with an interactive question: How often do you use data analytics when making investment decisions?
- All the time
- Sometimes
- Rarely
- Never
Once you answer the above question, let’s explore how data analytics can assist you in making informed investment decisions.
Predictive Analytics
It is among the most significant data analytics applications in the stock market. This method uses past data to predict future market patterns, stock prices, and earnings. To assist investors in wise investment decisions, investors can utilize predictive analytics to spot patterns and trends in the stock market.
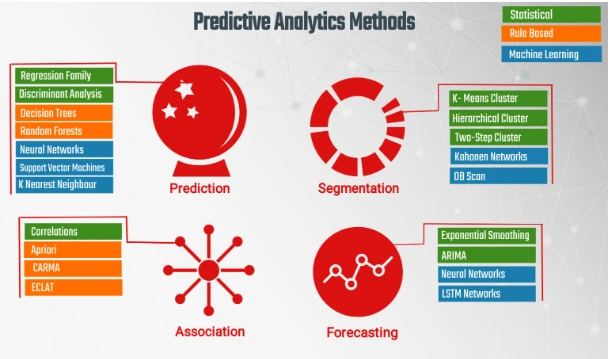
The global predictive analytics market was valued at $7.32 billion in 2019 and is expected to increase at a CAGR of 21.9% from 2020 to 2027, reaching $35.45 billion by 2027. Compared with other regions, North America is expected to have the highest adoption of predictive analytics solutions.
Sentiment Analysis
This method involves examining news articles, social media messages, and other online sources to evaluate a company’s or stock’s overall opinion. This assists investors in determining the market mood and making better-educated selections.
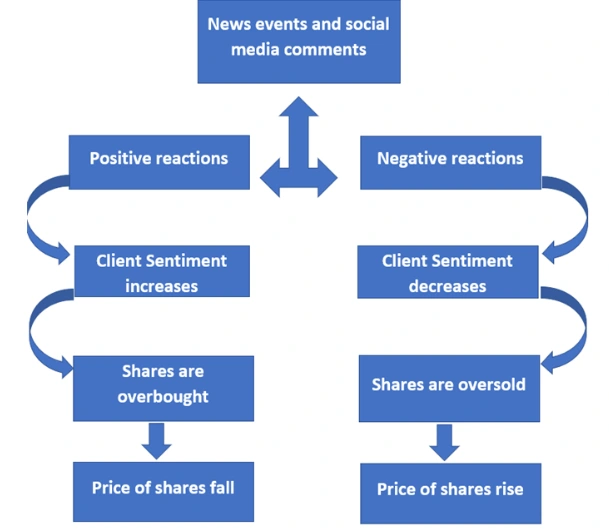
When the market mood shifts swiftly and a substantial number of market players shift from bullish to negative or vice versa, the largest price fluctuations occur. When the circumstances for rapidly shifting sentiment are met, the most profitable opportunities emerge.
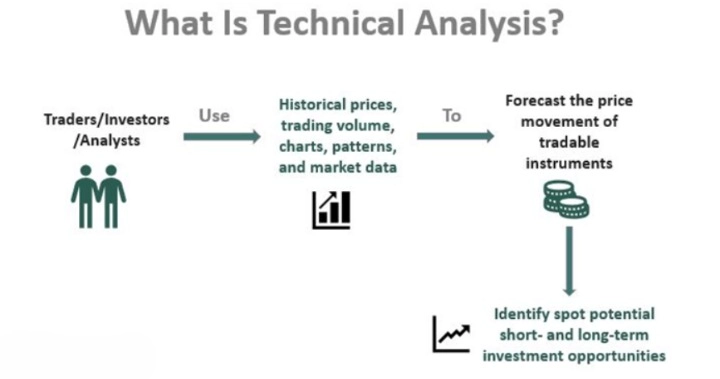
Technical Analysis
Technical analysis is a tool that helps investors understand when to begin or leave a trade and what price information is. These criteria determine the success or failure of the transaction. Technical indicators supplement all other types of technical analysis by providing extremely short-term information about how a firm or index may behave.
Algorithmic Trading
Algorithmic trading involves using computer programs to make investment decisions, execute trades, manage risk in real-time, analyze vast amounts of data, identify patterns and trends, and make trades based on predefined rules and parameters.
Consider if a trader could plan ahead of time and design an algorithm. This algorithm would buy 100 company shares when the price rises over the 7-day moving average (DMA) and vice versa. The machine would buy 100 shares on the trader’s behalf when the stock price rises over the 7-day DMA. We can substitute DMA for any other input data or combine various measurements. All of this is made feasible by algorithmic trading.
The main advantage of algorithmic trading is the simultaneous monitoring of several metrics, which refers to how a trading computer software monitors multiple metrics simultaneously. The global algorithmic trading market size was valued at $2.03 billion in 2022 and is projected to grow from $2.19 billion in 2023 to $3.56 billion by 2030. In India, the percentage of trading accounted for by algorithmic trading is around 50–55%, while globally, the number goes up to 80–85%.
Conclusion
The integration of data science in stock market trading has revolutionized how investors approach their strategies. From predictive analytics that provide foresight into market behaviors, sentiment analysis revealing market moods, technical analysis guiding entry and exit points to algorithmic trading automating processes, data science tools are indispensable for modern traders.
The rapid growth in these areas, demonstrated by market valuation projections and adoption rates, emphasizes the increasing reliance on data-driven insights in the financial sector. As technology advances, it’s clear that the synergy between data science and trading will only deepen, rendering a data-informed approach not just advantageous, but essential for traders and investors alike.
References
https://news.mit.edu/2019/model-beats-wall-street-forecasts-business-sales-1219
https://www.investopedia.com/terms/t/technicalanalysis.asp
https://www.investopedia.com/terms/q/quantitativeanalysis.asp


