There was a time when the internet was more text than pictures. Downloading pictures took minutes and videos, hours. More visual content meant more waiting. In short, online content was limited to text.
Fast forward to 2017, and there is no denying that the world we live in is more visual than textual. Visuals have always been constant in the marketplace, and the more recent trends have only further established the visual side of marketing. After all, the human brain only takes 13 milliseconds to process an image.
In the current scenario, the first 90 seconds that a customer is exposed to the content is the most crucial. The customer will likely lose interest and move on to another activity. Considering the short time to capture interest, images are the most efficient way to tap into customers’ decision making.
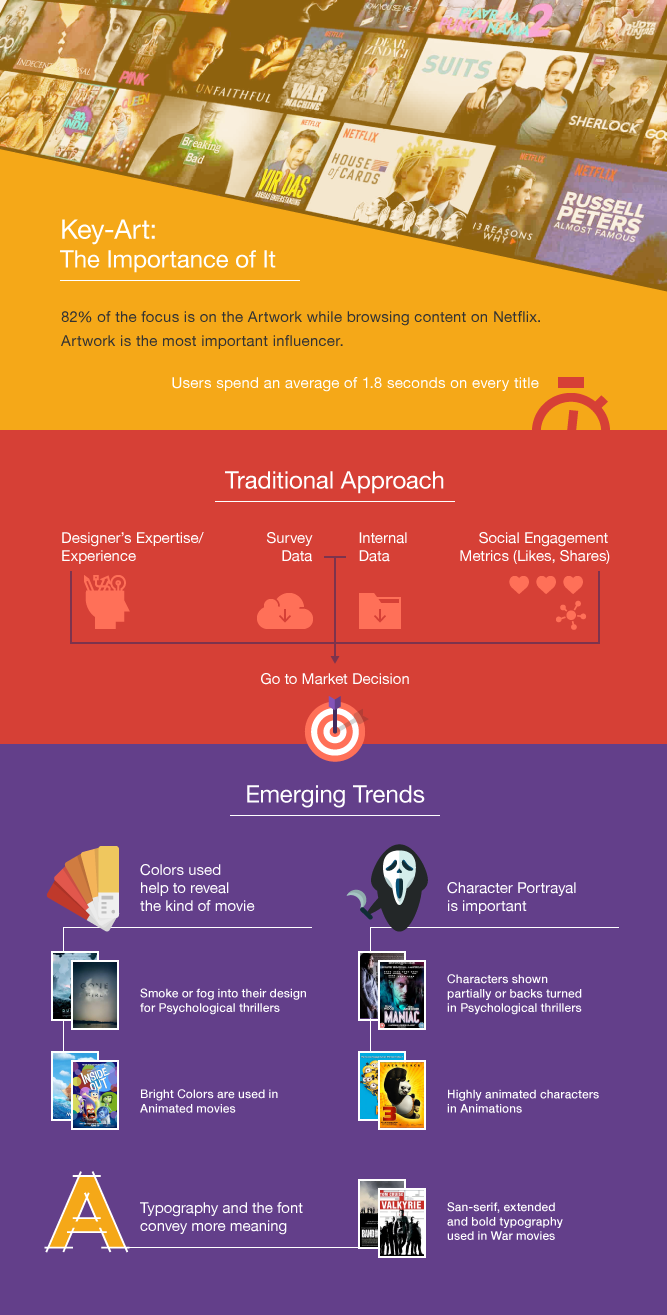
This complements a research conducted by Netflix, where they found that 82% of the customers’ focus is on the artwork while browsing content on Netflix and a user spends an average of 1.8 seconds on every title. How’s that for visual appeal?
Major takeaways from the A/B test conducted by Netflix:
- One of the earliest trends observed was that an image’s tendency to get noticed dramatically drops when it contained more than three people. Audience found it hard to focus when there were too many people, and were not be able to absorb cues about the storyline
- While ensemble casts are fantastic for a huge billboard, they are too complex to look at on smaller screens. Ultimately, they are not as effective at helping members decide if this is a show they would like to watch simply by looking at the title
(Source: https://media.netflix.com/en/company-blog/the-power-of-a-picture) - Orange Is the New Blackis a good example of this. As the number of characters on the poster decreased, the number of viewers who clicked on the icon of the TV series increased
To better understand images, we need to truly convert them into numbers. This is where image processing comes in. It helps convert the visual image into numerical data points for further processing. Analyzing this data helps identify patterns and derive insights, which in-turn helps data-driven business decisions. Various attributes like color schemes, typography, volume of text, number of characters on the poster can be extracted from an image.
Use case: Image processing to predict movie success
For a global media & entertainment company, LatentView extracted over 6000 movie posters from IMDB along with their metadata (genre, cast, production, ratings etc)to predict the movies success using image analytics. The color schemes and objects in the movie posters were analyzed using Machine Learning (ML) algorithms and image processing techniques. Data obtained was later clustered to arrive at the image characteristics pertinent to each genre.
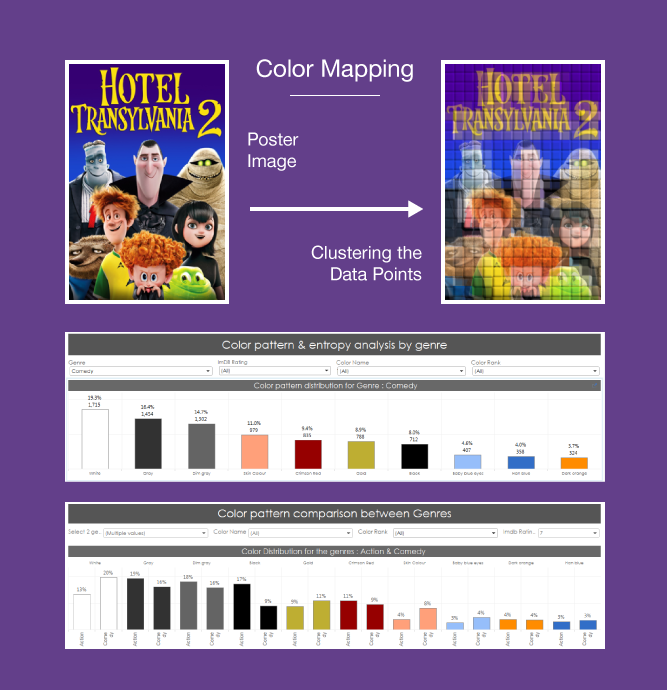
Step 1: Color Mapping
The first step involves Machine Learning (ML) on each of the images to identify top five recurring colors. The color clustering method extracts representative colors of the image and shows how the pixels in the image partitions into groups. Ideally, this will indicate what colors are most representative of the image. Next step is to compare the extracted 5 RGB values from each poster to a pre-determined set of colors and standardize them to represent 24 standard RGB colors based on the minimum Euclidean Distance. Construction of a custom palette of features based on the artifacts of similar titles is used to build a poster for a new title with those characteristics.
Step 2: Feature Extraction
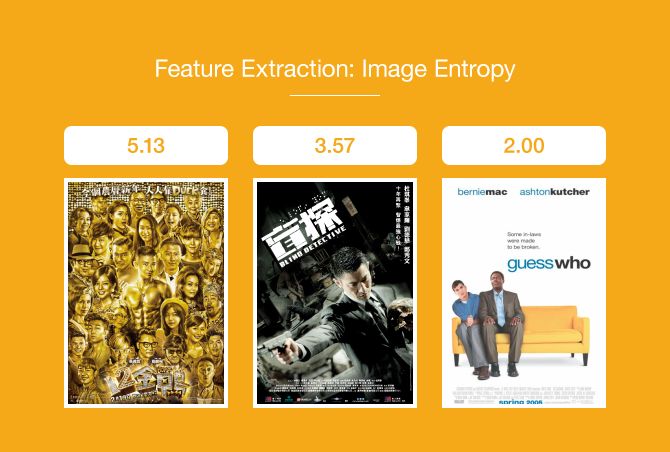
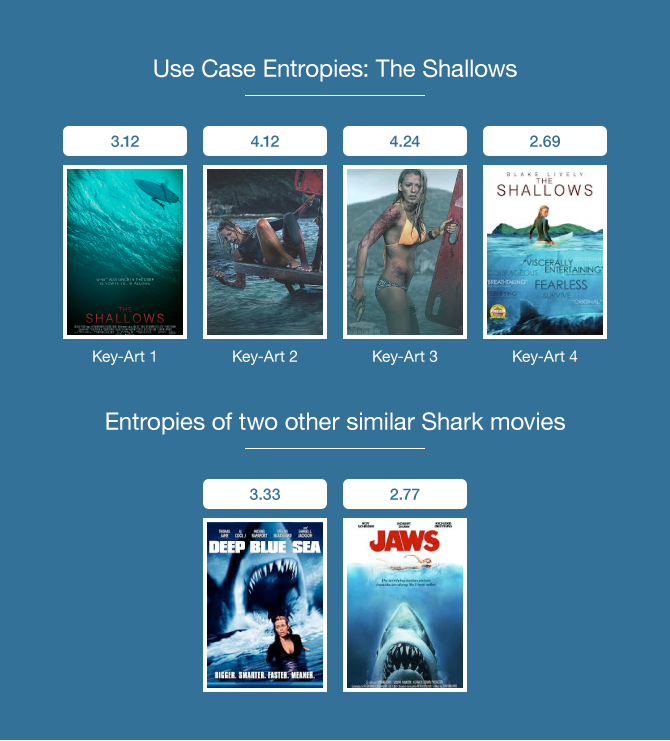
Using Image Entropy, we quantify how `busy’ the image is, i.e. the amount of information which must be coded for by a compression algorithm. It can be understood as the element of surprise experienced while moving from one pixel to another pixel in an image.
Decoding the movie posters: The Shallows
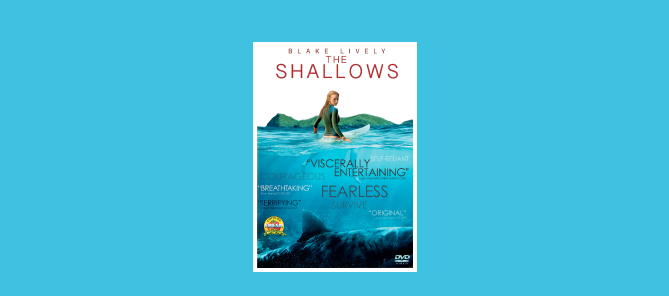
Here we compare the entropy of ‘The Shallows’, to two other shark movies which were also the talking point in social media during the film’s release. Key-Art 1 has a value close to ‘Deep Blue Sea’ and Key-Art 4 has a value close to ‘Jaws’. Additionally, these two posters have relatively lower entropy with the image seeming less busy.
Based on the analysis done with the color classification and entropy, our recommendation was that Key-Art 4 closely resembled the characteristics of past successful movies in a similar genre.
In today’s world, images and image sequences (videos) account for around 80% of all corporate and public unstructured big data. As growth of unstructured data increases, analytical systems must assimilate and interpret images and videos as well as they interpret structured data such as text and numbers. The future is now. The future is visual.
To know more about LatentView’s Image Analytics solutions, please write into: marketing@latentview.com
