

Introduction
Computer vision is a field of artificial intelligence that deals with how computers can interpret and understand the visual world. It aims to understand and automate tasks that the human visual can do. The computer vision market is expected to grow from $10.9 billion in 2019 to $17.4 billion by 2024-growing at a CAGR of 7.8% during the forecast period(1). Computer vision has applications across multiple industries, some of the prominent ones are
- Automotive – Companies like Google & Tesla use computer vision cameras for improving their self driving cars
- Retail and Retail Security – Automation of inventory management, analysing customer footfall and security for theft are the major applications
- Healthcare – Computer vision is being used to help diagnose/predict health conditions like cancer in early stages
- Agriculture – Precision farming and early detection of crop diseases to optimize yield
- Manufacturing Industries – Detecting manufacturing defects not visible to human eyes
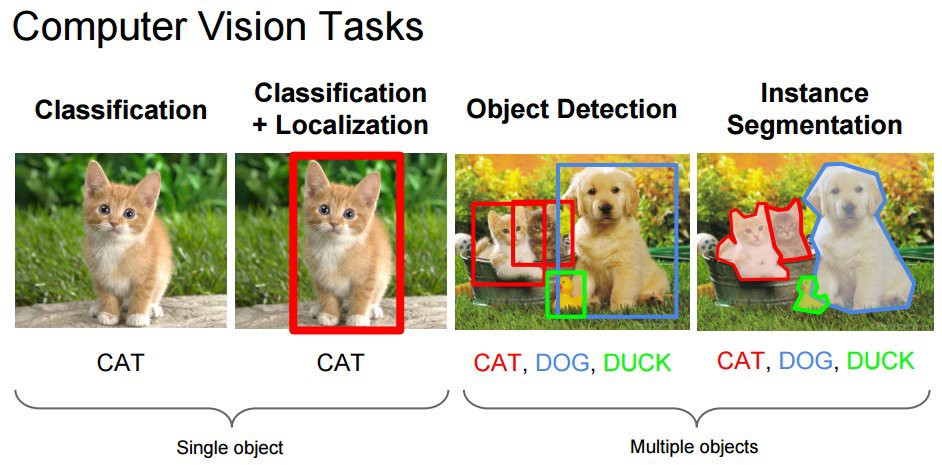
In Computer Vision, a scene is a view of a real-world environment that contains multiple surfaces and objects. Scene understanding can include multiple tasks which are:
- Classification of a Single Object – Detecting the class of an object
- Classification + Localization of an Object – Locating the object along with detecting the class of an object
- Object Detection – Classifying and localizing multiple objects in an image
- Instance Segmentation – Segmenting the exact instances of the object, along with classification
In this article we will mainly focus on object detection. Let’s look at some of the major applications of object detection.
- Self-Driving Cars
Cars which are capable of moving on their own with no human guidance. Object detection techniques enable the car to detect other objects like vehicles, pedestrians etc. Google’s sister company Waymo is the industry leader in self driving cars with more than 20 Million Miles driven in the US. Other major players include companies like General Motors, Tesla
- Face Detection & Face Recognition
Face Detection & Recognition has a wide array of applications like security applications, forensic investigation, identity validation at ATM, control access to sensitive areas. Snapchat, Instagram and Facebook use face-detection algorithms to apply filters and recognize you in pictures.
- Object Tracking
Object detection is used in tracking the objects. Some of the examples include tracking movement of a cricket bat, tracking a ball during a football match, tracking a person in a video. Object tracking has multiple uses, some of which are surveillance and security, traffic monitoring.
Object Detection in Real Time
Human beings can look around things in microseconds. This is infact object detection in real time. For problems like self driving cars, the algorithm should be able to detect objects and make inferences within microseconds. An average video is made up of ~24 frames per second (fps) and a detection in real time requires the algorithm to be faster than this speed.
The algorithms for object detection can be broadly classified as:
- Region Proposal Based Algorithms- These algorithms are implemented in two stages. First, a region of interest in the image is selected. Second, these regions are classified using convolutional neural networks. This solution is slow because we have to run predictions for every selected region. These are the RCNN family of algorithms – Region-based convolutional neural network (RCNN) and Fast-RCNN, Faster-RCNN. RetinaNet is also an example of this type of algorithm.
These techniques work well when we do not need real-time detection but they tend to struggle with real time detections due to their slow speed.
- Single Stage Algorithms- They are used for real-time object detection as, in general, they trade a bit of accuracy for large improvements in speed. Unlike the RCNN family, there is no bounding box proposal and subsequent pixel or feature resampling stages. A neural network predicts bounding boxes and class probabilities directly from full images in one single evaluation. The best examples of this group are the YOLO (You Only Look Once) family algorithms and SSD (Single Shot Multibox Detector).
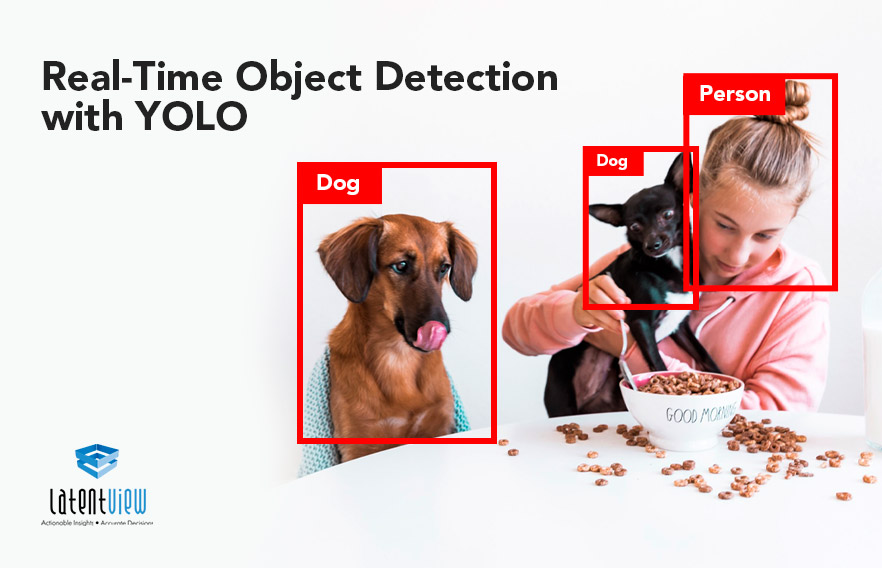
In this article we will focus on the YOLO algorithm for real time detection.
YOLO – You Only Look Once
YOLO is the state-of-the-art, real-time object detection system based on the darknet framework. On a Pascal Titan X YOLOv3 processes images at 30 FPS and has a mAP(mean Average Precision) of 57.9% on COCO test-dev(2), a faster version runs at ~ 150 FPS (with less mAP). YOLOv3 is ~100X faster than fast RCNN and 1000X faster than RCNN, while being at par with the accuracy and hence suitable for real-time object detection. Complete prediction is done in single evaluation of the image and hence the name YOLO.
Performance Comparison with other detectors
Compared to the other detectors, YOLOv3 is at par with mAP but much faster than other detectors.(2) Moreover, we can easily trade-off between speed and accuracy simply by changing the size of the model.
YOLO takes the input image, divides it into S X S grid cells. If the center of an object falls into a grid cell, that cell is responsible for detecting that object. Each grid cell predicts B bounding boxes, confidence scores for those boxes and C conditional class probabilities. We multiply the conditional class probabilities and the individual box confidence predictions at test time, which gives us class-specific confidence scores for each box. Below are mathematical definitions –
Box Confidence Score=P(Object).IoU
Conditional Class Probability=P(Class|object)
Class Confidence Score = P(Class).IoU= Box Confidence Score X Conditional Class Probability
where
- P(Object) is the probability that box contain an object
- IoU is the intersection by union ratio between predicted box and ground truth
- P(Class|Object) is the probability the object belongs to a class given an object is present
In order to understand the YOLO algorithm, we must first understand what YOLO predicts i.e. the components of bounding boxes and anchor boxes.
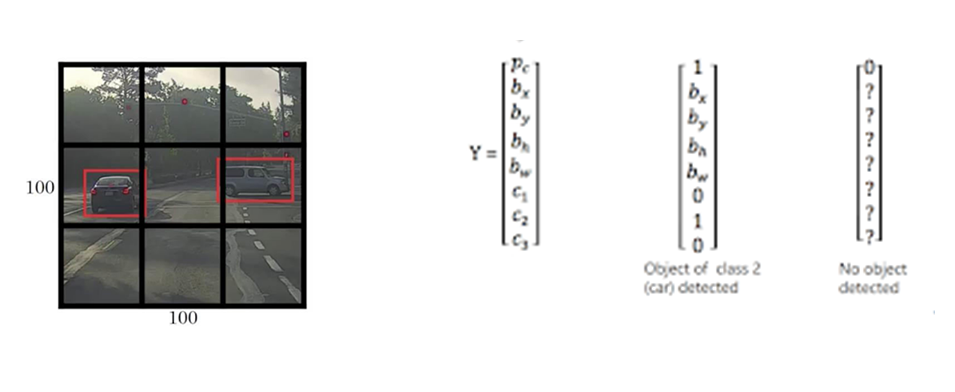
Bounding Box – Yolo takes the input image and divides it into S x S grid, say 3 x 3 grid. Let’s assume there are three object classes Person, Car, and Truck. For each grid cell, the label y will be predicted which is an eight dimensional vector where
- pc- probability whether an object is present in the grid cell or not
- bx, by – center coordinates (x,y) of the bounding box with respect to the grid cell
- bh, bw – ratio of height (bh), width(bw) of the bounding box with respect to the grid cells
- c1, c2, c3 represent the classes. If the object is a car, c2 will be 1 and c1 & c3 will be 0, and so on
Anchor Boxes– If the center of multiple objects lie in the same cell, we will only be getting one of the two boxes, either for the car or the person. Hence, YOLO uses predefined multiple anchor boxes (in this example 2) for each grid cell.
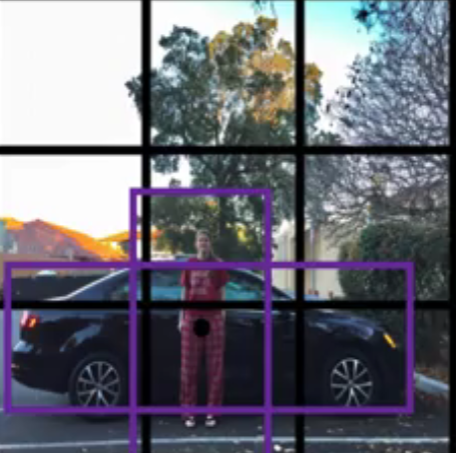
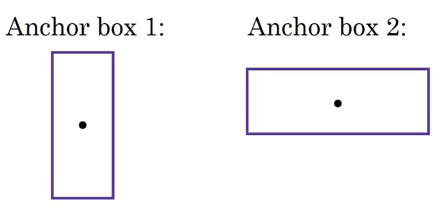
The y label with two anchor boxes will be:
Totally there are 16 rows, 8 for anchor box 1 and remaining 8 for anchor box 2. Output in this case, instead of 3 X 3 X 8 will be 3 X 3 X 16.
YOLO Processing
Now that we have understood the concepts of bounding and anchor boxes, let’s look at the step by step process through which YOLO makes predictions.
- Input Image Processing
The input image is passed through a deep CNN network which is a series of Convolution and Maxpool layers, followed by two fully connected layers to get the output (Figure 9).
Let’s look at an example of an image to understand this (Figure 10). The input image in this case is divided into 19*19 grids cell, with 5 predefined anchor boxes for each grid cell (generally used, might differ as per YOLO version). Totally we will have 1805 anchor boxes and each anchor box will have 85 predicted elements by the network as the output
- probability of an object -pc
- Bounding box coordinates- bx,by,bh,bw
- 80 class probabilities – c1 to c80
- Computing Class Scores
For each anchor box of a grid cell, we compute element wise product and extract a probability that a box contains a certain class and select the class with maximum probability score. In the image below, c3 has the highest probability and we select the class corresponding to this object for this anchor box 1 for a grid cell. Further, we take a max of probabilities across all the anchor boxes, resulting in one class prediction per grid cell.
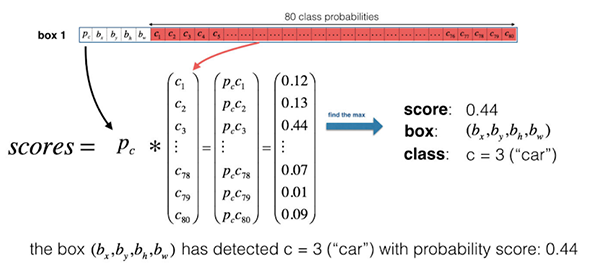
The output from class scores will look something like this-
- Filtering with a threshold on class scores
After prediction of the class probabilities for each of the grid cells, we can still get multiple unnecessary anchor boxes. We discard all the boxes having probabilities less than or equal to a predefined threshold. The common threshold used is ~.5, but can vary depending on the use case.
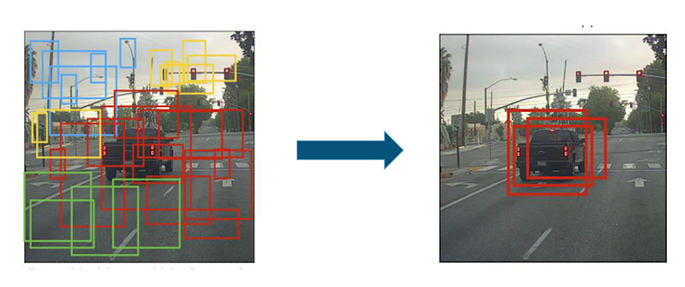
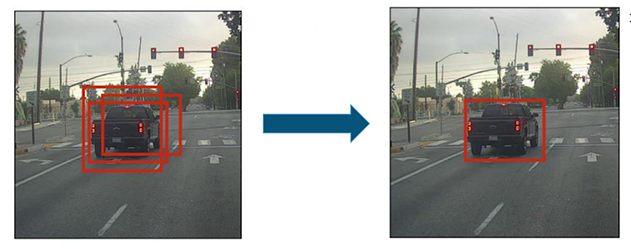
- Non Max Suppression
After filtering the anchor boxes with probability less than the threshold, we can still get multiple overlapping anchor boxes for the same object. Hence we use the Non Max Suppression algorithm to get the final predictions.- Take the anchor box with the highest probability for a particular class as the output for that class
- Discard any other anchor box for the same class which has IoU (Ratio of Intersection and Union for two boxes – Figure 8) greater than the threshold, usually .5 with the anchor box from above for
- Repeat step 1 until all the anchor boxes are either taken as the output or discarded
- Take the anchor box with the highest probability for a particular class as the output for that class
Implementing Object Detection using YOLOv3
Description:
At LatentView, we have used YOLOv3 to implement object counting using the people counter use case. The algorithm automatically identifies the class of interest and their respective bounding box and maintains a counter
Training:
We have used the pre-trained YOLOV3 model, which is capable of detecting “person” as a class and we count the number of people by maintaining a counter.
Testing:
We pass the input images of people standing at a counter.
Test 1
Test 2
We have successfully implemented object detection using YOLOV3. We can see from Test 1 results that YOLO performs very well when objects are distant from each other. But from Test2 , we can see that it struggles in case of objects that are overlapping or appear in a group.
Conclusion
YOLO is the state of the art real-time object detection algorithm as it is much faster compared to other algorithms while being able to maintain a good accuracy.YOLO network understands generalized object representation, however the spatial constraints limit the accuracy in case of nearby and smaller objects. We have a newer version of this algorithm, YOLOv4 which addresses this problem and is more accurate and faster(7). Overall, YOLO’s speed and accuracy makes it a widely used algorithm for real-time object detection.


