


In recent times there has been a humongous amount of data generated every day, and companies want to utilize the data and generate actionable insights to change their strategies and gain profits from it. Companies are investing in Data Science and Data Analytics to help them in rebuilding their strategies. EDA plays a powerful role in this process. Data Scientists, Data Analysts, and Machine Learning Engineers spend so much time on EDA to derive insights, build and optimize machine learning models.
What is EDA?
Exploratory Data Analysis is a process that was developed by “John Turkey” in the 1970s. In statistics, it’s referred to as the first process of understating the structure of data and allows us to uncover patterns and insights. EDA is often the first step in the data modeling process. According to Wikipedia, it is defined as, an approach to analyze data, summarize the main characteristics, and understand the structure of the data, often with visual methods.
Why is EDA Neglected?
In general, many who aspire to become data analysts or data scientists neglect the importance of EDA and outcomes of EDA. There are different reasons to do so such as not knowing how to use the outcomes and working professionals avoid it due to hard deadlines. This results in the creation of inaccurate models or accurate models with inaccurate and noisy data. This can be an inappropriate approach because without understanding the findings from EDA and implementing them, it is not advisable to create a model.
It is said that profound data scientists and machine learning engineers use 50% to 60% of the time in EDA and preprocessing. Only good and clean data can get you a good model, right? People who are working on data should develop the practice of performing EDA and implementing the results along with findings and manipulate the data wherever needed for better outcome of the model. Now let’s see some important points in EDA.
Why do we need EDA?
EDA plays a critical role in understanding the,” what, why and how” of a problem statement. It allows a person to investigate and understand the data thereby helping the person to make critical decisions on what is interesting to pursue and what is not worth following up. It helps in building hypotheses using relationships between variables so that one can decide if the selected features will be a friend or foe to the model. The other main outcome of EDA is to understand the distribution and the structure of the data. Many tests, techniques, and plots help us in determining the best distribution and structure of the data which helps us to take necessary steps in pre-processing.
How do you perform EDA?
There are many techniques and process where we can perform EDA, in general, we would like to gain the following outcomes from basic EDA:
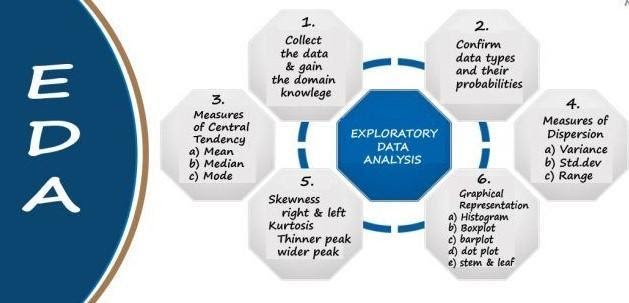
Description of data: There are functions in python such as describe(), head(), unique(), summary(). Plots can be generated using distplot(), histograms, many more from matplotlib, seaborn, and other similar packages. It also helps us to find out some other properties of the data such as trends and seasonality. This is important especially when we are dealing with time-series data and with the help of EDA, we can also find imbalanced datasets. This helps to choose the evaluation metric according to the imbalance dataset.
Missing Values: Real-world data is rarely clean, data can be either missing because of incorrect data extraction or human errors or due to several other reasons, and there can be scenarios where we will see duplicated records which also says that one record may be missing or was mistakenly inserted into the data. Missing values and duplicated records need to be handled carefully because they will reduce the performance of the model and lead to the wrong prediction. We can use imputation techniques such as mean, median, mode, or use advanced imputation methods like simple imputation, k- nearest imputation, etc. If the missing values are more than 15% we can drop the column since imputing huge data is not advisable.
Outliers: Outliers denote those data or values that are different and beyond the normal range. These may be caused because of mistakes during data collection or it can be a real value as well. These outliers tend to make your data skewed which makes the model biased towards some values which results in incorrect predictions. One can check for outliers with the help of boxplot, histogram, IQR, Z-Score and scatter plots. Machine learning models cannot be fed with noisy data, we must deal with outliers, the most generally used method is IQR with this method we can remove outliers, there is another method which is Minkowski Error, unlike the other methods this does not detect or clean the outliers but it helps in reducing the impact of outliers on the data. This can be used in cases where there are outliers but the datapoint is very necessary for the business perspective.
Relationship between two variables: During the process of modeling certain assumptions are to be satisfied for certain algorithms, so it is mandatory to check the relation between the variables and treat them accordingly in the pre-processing steps. Heatmaps and histograms help us with analyzing the relationships.
To Generate Insights: EDA can be used to generate a number of insights that are In your data which will help the person to model the data accordingly and perform different preprocessing operations to feed the model with a better data, there are different kinds of plots and methods to generate insights, one can use plots or can use tables and different grouping actions to generate insights. These are some examples of charts that we can build to perform EDA.
The Recommendation: EDA is the important part but not the hard part in the process or working with machine learning models, it has become a necessity for one to understand the data before creating a model and interpreting the model’s outcome based on the data provided. With continuous contributions from all around the world to the field of data science, there are many new tools in the market to practice EDA such as plotly, bokeh, pandas profiling, MPLD3, missingno. These packages provide the capabilities to explore more visually and traverse across the findings from data. We should not underestimate the power of EDA and therefore utilize it for the greater good of the model.


