

A Prelude
Named after a Russian Mathematician Andrey Markov, Markov Chains deal with a sequence of possible events in which the probability of the next event depends only on the current state of the event. The underlying base idea of a Markov Chain is a “Markov Property” aka “Memoryless property” that states that as long as we know the current state of the process, any more information about the past states would not be helpful in predicting the probability of future state of the process. It is by virtue of this assumption that Markov Chains finds its use in many applications.
Introduction
Markov Processes are essentially random processes that satisfy “Markov property”. A random process (aka stochastic process) is a collection of random events whose outcomes are denoted by a set of random variables. Let us consider the task of picking a card from a full deck of 52 cards. If we were to denote the probability of such a card to be a ‘face card’ i.e, either one among King, Queen, Jack, Ace to a random variable ‘X’, then a random process could be thought of as repeating this same experiment once everyday. The collection of such outcomes denoted by the value of ‘X’ is discrete in a sense that the changes to the random variable ‘X’ happen at discrete intervals in time and hence this is called the ‘Discrete-time random process’.
Contrastingly, a ‘Continuous-time random process’ is one where a random variable takes continuous values and lacks any “steps” in its appearance. For example, an experiment where a random variable ‘X’ denotes the current share price of a trading stock is continuous-time in nature. A ‘Markov Chain’ usually refers to a discrete-time Markov process.
How does it work?
A state-space is a collection of all the possible states the process(application) can take. The working of Markov Chains can be explained below :
Flowchart depicting the working of Markov Chains
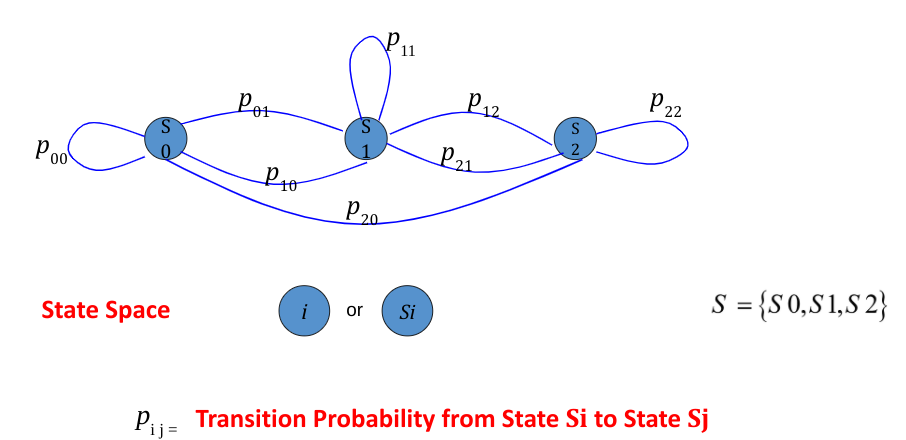
A general model of markov chains showing the three states S0,S1 & S2 in its state space S and their transition probabilities in the form a directed graph below,
Let us understand the working of Markov Chains by taking a real world example. If we were to predict the weather for future based on general assumptions that
- If it is a Sunny day today, there is 70% probability for the next day to be Sunny as well while 30% for it to be Rainy.
- If it is a Rainy day today, there is 80% probability that next day is Rainy too while 20% probability for it to turn Sunny.
We begin by noting down all the possible states to define the state space S. For this example,
S = {Sunny Day, Rainy Day}.
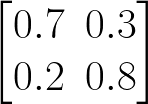
Next step is to construct the probability transition matrix which shows us the general probabilities for all possible transitions in the state space.
| States | Sunny | Rainy |
| Sunny | 0.7 | 0.3 |
| Rainy | 0.2 | 0.8 |
Probability Transition Matrix
The same information is also represented in the form of a directed graph below showing the transition probabilities for each possible transition. [1]
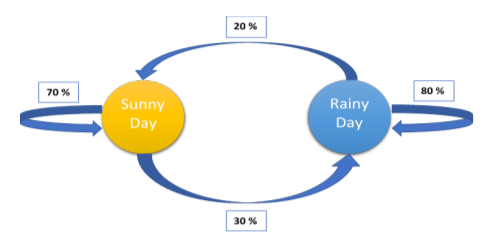
Directed Graph
By Markov chains assumption, any state Sn can be represented as
Sn = Sn-1 * P
where P is the transition probability matrix.
Since calculations for successive states are of the same form, it can be generalized that any state Sn can be represented as
Sn = S0* Pn
Now, let’s assume that today is a sunny day and we are interested in finding the weather 3 days later. So we have
S0 = {1, 0}
S3 = S0 * P3
= [1 0] * 3
= [0.475 0.525]
Hence the probability of it being a rainy day three days later is 52.5%.
Various Use Case Scenarios
Markov Chains can be designed to model many real-world processes and hence they are used in a variety of fields and applications across domains. Some of them include:
Domain Applications:
Some of the applications of Markov chains include but not limited to,
- Marketing
- Multi Touch Attribution – Assigning credit for a user conversion to the various marketing channels he/she interacted with, by modeling them as states the user transitions from prior to conversion.
- Finance
- Predicting patterns in future market behavior – Using Markov chains to predict whether the market next day is going to be bullish or bearish based on the knowledge of current market conditions.
- Biology
- Modeling of animal populations evolution as stages of transition from one state to another
- Applied Engineering
- Page Rank Algorithms – Modeling the various web pages as states a web surfer would transition from, Markov chains are used to efficiently rank various pages using stationary distribution over them as a factor while ranking.
- Mathematical modeling of Stochastic processes
- Brand Monitoring
- Predicting the probability of users switching from one brand to another by modeling different brands as discrete states of a Markov process.
The problem that Multi Touch Attribution tries to solve
Businesses today run their marketing campaigns on multiple platforms like Paid Search, Email, Facebook, Instagram, YouTube Videos etc to name a few. However the idea of knowing how effective these channels are in driving the conversions/leads is very crucial to identify the ROI for each of these channels which further helps in the betterment of marketing budget allocations in future. There are three conventional, simple yet powerful methods in common practise to attribute the conversions to the marketing channels involved. Let us understand them through a simple example:
Imagine you are advertising your product on multiple platforms and let us look at a user Kiran’s interaction with these channels.
Kiran’s awareness of the product is sparked by a Facebook Ad he found while browsing through his feed and he clicks on it and lands on the product website where he further familiarizes himself with the product but he does not make a purchase as there is no intent yet to do so. Next day he gets an Email about the product and he dismisses it and on Day 3 when he sees a video ad in YouTube on this product and lands him on the product website again, he proceeds to finally make a purchase. yay!
“Last Touch Attribution” as the name suggests would attribute Kiran’s conversion to YouTube completely. Although this approach is simple, it would be oversimplifying to discard Facebook touch which had actually sparked the awareness about the product in the first place.
“First Touch Attribution” , similar to Last touch attribution, rewards only Facebook for Kiran’s conversion. We know this isn’t completely true because Kiran did not have an intent to purchase yet right after his interaction with Facebook channel.
“Linear Attribution (or) Full Attribution” gives all the channels an equal weightage to their contribution in the user conversion. So each of Facebook, Email and YouTube gets 0.33 credit for Kiran’s conversion. This isn’t exactly correct too because Email might not have been as effective as Facebook which sparked initial awareness or YouTube which led to the purchase.
Markov Chains Approach
Markov Chains lets us model the attribution problem statistically as users making a journey from each state, which is a channel here, to finally reach a state of conversion and allows us to identify the probabilities of transitioning from one channel to another. These transition probabilities help us identify the statistical impact each channel has on overall conversions.
Hence the algorithm for Markov Chains in the context of Multi Touch Attribution can be summarized in below steps:
- From the user-level data of journey information, find the transition probabilities between all the states in the state-space.
- Using removal effects, find the relative importance of each channel by looking at how the removal of one channel affects the overall conversions.
To understand the process in a simple manner, let us assume that journeys of 3 users with respect to their interactions with 3 marketing channels C1, C2 and C3 is as listed below:
| Customer | Channels | Conversion |
| 1 | C1 -> C2 -> C3 | Yes |
| 2 | C1 | No |
| 3 | C2 -> C3 | No |
We begin by finding the transition probabilities for all possible transitions in the state space S defined by S = {Start, C1, C2, C3, Conversion}.
For instance, let us take the transition from C1 -> C2. Two customers (1 & 2) touched C1 and only customer 1 made the transition from C1 to C2. Hence the transition probability for C1 -> C2 is therefore ½=0.5
Similarly obtaining transition probabilities for every other transition, we can represent them using a directed graph as below,
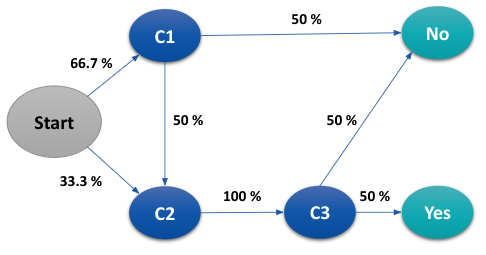
The overall conversion probability from the dataset is ⅓ which is 0.33. Using removal effects, we now find the relative importance of every channel. Let us take channel C1 for instance. Removing C1, directed graph changes to
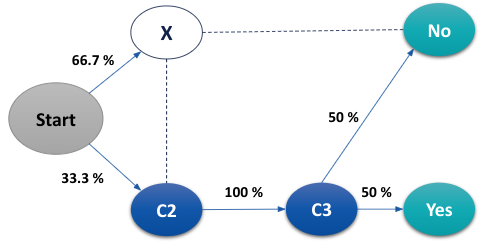
The probability of overall conversion is now changed to 0.33*0.5=0.16. The removal effect of C1 is 1-(conversion probability after removal / conversion probability before removal).
= 1 – (0.16/0.33)
= 0.5
Similarly for C2 & C3, we observe that removing either of them means that new conversion probability will be 0. Hence removal effects for C2 & C3 are 1 each.
Now we use the removal effects of each channel as their corresponding weights in arriving at each channel’s contribution towards conversion i.e., the overall 1 conversion can be attributed among C1, C2 and C3 as
C1 = 0.2, C2 = 0.4, C3 = 0.4
Advantages compared to Traditional Methods
Traditional attribution models like first touch/last touch/linear touch are fixed in a sense that they do not take into account the structure of the data whereas Markov Chain models look at the customer journeys and specifically give importance to each transition made by an user leading to his/her conversion. Hence the results from traditional methods may sometimes lead to overconfidence.
An example implementation of Markov chains to a sample problem for which traditional models are implemented too shows some contrasts in the final results:
Least number of customers have their journeys ending with either channel 3 or channel 4 and hence these channels are given lesser attribution by traditional methods compared to other channels. But since Markov chains look beyond just the first or last touch, it can be observed that more conversions are attributed to channel 3 and 4 in Markov chains than by other methods.
Accurately evaluating the impact of any one channel on the overall conversion in the framework where a customer interacts with multiple channels could be a complex task but it surely is a rewarding effort too. The ready availability of R libraries like “ChannelAttribution” (and function “markov_model”) mean that it is now easier to implement Markov Chains to the attribution problem. The results from Multi Touch Attribution using Markov Chains gives us a snapshot of the performance of channels (or campaigns in a larger sense) at a given point in time. Whenever a new campaign is going to be launched, running Multi touch attribution before and after the campaign launch could give us insights into how well the campaign impacted user conversions.
Conclusion
The features like simple to use algorithm and computationally less intensive implementation makes Markov chains find their ready use in a diverse range of fields from Biology to Search Engine Algorithms. However the scope of implementation is limited to a set of problems that could be modeled as stochastic processes satisfying Markov property of memorylessness, for example we cannot use Markov chains to predict the trend of sales in next quarter if it depends not just on current state which here is current quarter sales but also on extraneous factors like seasonality, inflation etc. The limitation is further widened by its requirement to have a large input data of state transitions to be able to construct the probability transition matrix. There have been a few variants of Markov Chains (“higher order Markov Chains”) that were proposed to factor in the previous states too while predicting the future state and going into those details is beyond the scope of this blog.


