


Image Source: https://www.crespidb.com.br/blog/integracao-power-bi-e-power-automate/
The rising need for identifying the anomalies in business trends
Data-driven decision-making is being adopted more and becoming very popular across industries and domains. It is being viewed as highly impactful for the decision makers as the decision can now be made based on facts rather than opinions. In the quest to make data-driven decisions, organisations end up making tens and hundreds of BI dashboards and reports. However, the organisations are facing issues in handling those overwhelming reports and dashboards as it is becoming more difficult for business users to follow and get better insights from larger sets of information. And in order to identify the anomaly, a user must manually search reports and dashboards to find the outliers and take appropriate action.
In order to overcome this, automated anomaly detection is one of the most popular features today to notify business users on what to concentrate on. With Power BI’s latest anomaly detection feature, business users can now get alerts and notifications when an anomaly is detected, and not just that. With the inbuilt time series forecast feature, we can also predict the KPI trends for the upcoming time period. In this blog, we are going to see how Power BI’s inbuilt anomaly detection and forecasting features are going to help businesses make their day-to-day operations more productive.
What exactly is anomaly detection?
Anomaly detection is identifying items or observations that deviate considerably from expected patterns. The characteristics of data anomalies differ dramatically from those of normal data. In machine learning, we detect anomalies in a dataset using unsupervised data processing techniques/algorithms. It allows us to improve our line charts by automatically recognising anomalies in our time series data and providing explanations to aid in root cause analysis. We can get insights without chopping and dicing the data with only a few clicks. Both Power BI Desktop and the Power BI service allow us to visualise anomalies. Moreover, we are using Power Automate to export the Power BI reports to the mail.
Flow Chart

Procedure
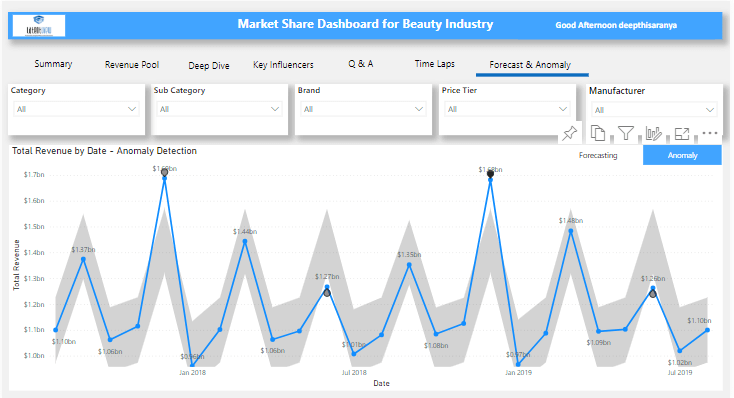
Select the line chart and add the “Find Anomalies” option from the analytics pane to find the anomaly detection. Anomaly detection only works on line chart visuals, and we need time-series data. More importantly, anomaly detection and time-series forecasting cannot work or be added concurrently in the same visual.
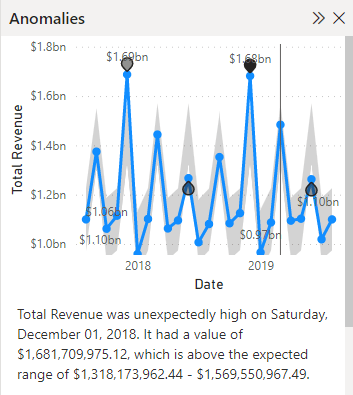
When we click on any point on an anomaly, it opens a separate pane where we can see possible explanations for the analysis across the fields. It provides a natural language explanation of the anomaly and related factors, grouped by explanatory strength, whether it is unexpectedly high or low.
Market Share Analysis for the Beauty Industry – Case Study
In one of our recent projects on “Market Share Analysis for the Beauty Industry”, we integrated anomaly detection features.
From the anomaly detection, we came to know that the overall income for the beauty business in December 2018 was 1,600 million, which is higher than the predicted range of 1,300 million to 1,400 million. On closer notice, the visual explains that there is an unexpectedly high revenue in December along with possible reasons in natural language.
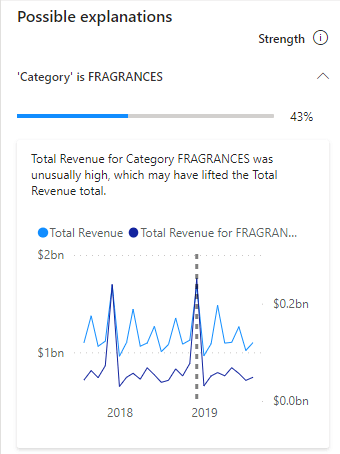
We can also choose which fields are used in the analysis. By dragging the category alone, Power BI limits the analysis to only those fields. The anomaly in December is likely to be related to a specific category in this case. The category “FRAGRANCES” has a 43% strength and generates high revenue. We can add this visual to our report page if we want to.
Forecasting
Forecasting is essential to understanding anomalies, as seen in the above sections. It is the most effective method for predicting future occurrences based on historical data, and for business operations, we can prepare ahead based on the projected events. In our use case, we used time-series data.
Time Series
A time series is a collection of data points arranged chronologically, and it is a collection of points taken at evenly spaced intervals over a period of time. Time-series forecasting is a data-driven approach to effective and efficient planning, which is required for prediction problems with a time component.
Time Series Forecasting
When working with machine learning, time series forecasting is significant. As stated in the introduction, it is used to forecast future values based on current data.
Time series analysis allows us to look at patterns such as trends, periodicity, changes that occur, and irregularities. Market share analysis, sales predictions, climate predictions, and business economic growth predictions are some of the prime applications of time series forecasting.
We can perform time series forecasting with Python and R script visuals, as well as Power BI Desktop’s built-in Forecast function Analytics Pane. From the Analytics Pane, we’ll show you how to use Power BI’s built-in forecast capability.
Time Series forecast chart in Power BI
Here we use a line chart to represent a forecast. The built-in forecasting approach in Power BI is used to detect seasonality in data and predict future values from a series of data. This saves a lot of our time from developing a dedicated forecast algorithm to do the same.
Data we use for Forecasting:
Considering the Market Share dashboard example in Power BI was designed to help us analyse the overall performance of different brands across categories and subcategories. We’re going to forecast revenue for the next two years using Market Share data for the Beauty Industry during the last two years.
To begin, we use the Date column as the axis and the Total Revenue column as the Values Field to build our Line chart design. The following is an example of our Line chart visualisations:
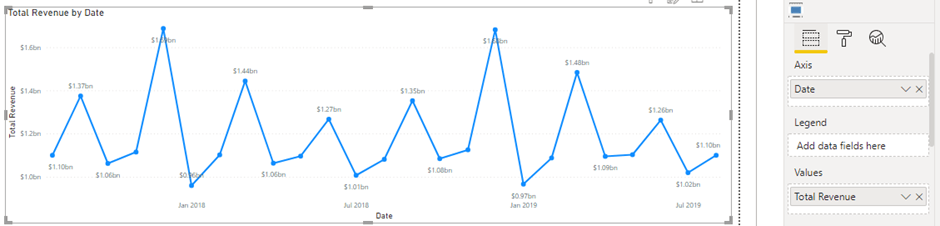
As previously said, we want to forecast the data for the following two years. We need to go to the Analytics tab in Power BI Desktop’s visualisation section to use the forecasting capability.
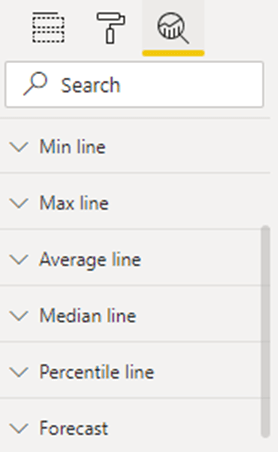
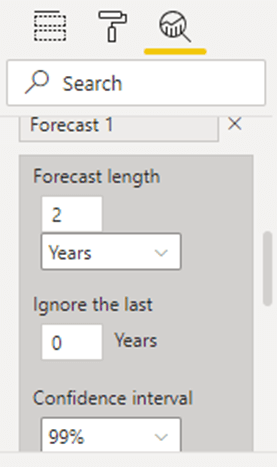
From the Analytics pane, select Forecast and enter the forecast length for the next two years with a 99% confidence interval before clicking Apply.
After we apply the forecast, our line chart will show the prediction for two years, and the predicted line will be coloured in light blue with confidence intervals.
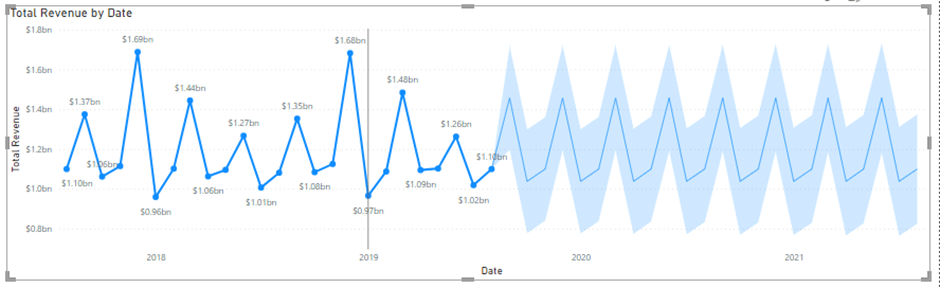
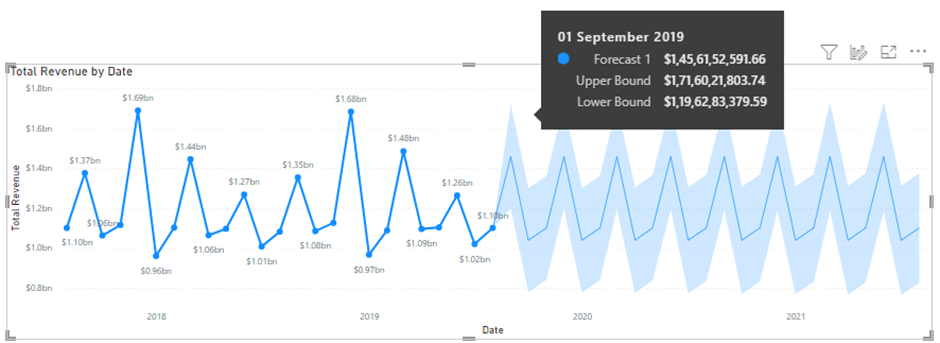
The tooltip for the Forecasting data on September 2019 is $1,45,61,52,591.66 with higher Bound and Lower Bound Revenue ($1,71,60,21,803.74 – $1,19,62,83,379.59), as shown in the above image.
How Power Automate is helping in Automating the flow
There are two ways to consume and export a Power BI report:
- In the Power BI service, we can subscribe to emails.
- Using Power Automate, we can export the report.
Here, we export the report by using Power Automate Flow.
Power Automate
Microsoft Power Automate is a solution for linking various apps and platforms to automate processes and operations. Users can link Microsoft Office 365 apps to each other and to a huge library of other apps in both cloud and on-premises environments, and by using Power Automate, we can get mail alerts for our reports and Apps.
Note – Our PowerBI account should be in premium capacity before exporting the reports. Premium capacity must be backed up by the report (not Premium per User capacity).
We can design and customise several types of workflows (Automated / Scheduled / Instant) and business process flows using Power Automate; it depends on the requirement. Here we are using Scheduled Flow to export the Power BI Report.
To send a Power BI report via email, we use the Export to File for Power BI Reports action.
Create a flow
Step 1: Sign in to Power Automate (flow.microsoft.com).
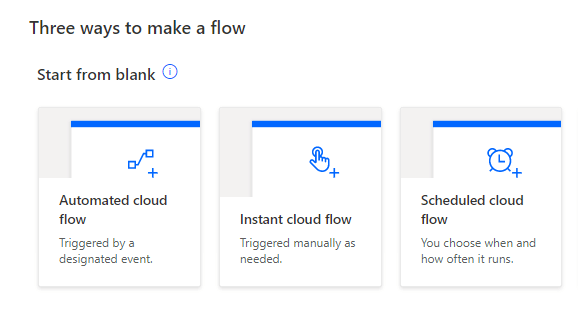
Step 2: Select Create > Scheduled cloud flow.
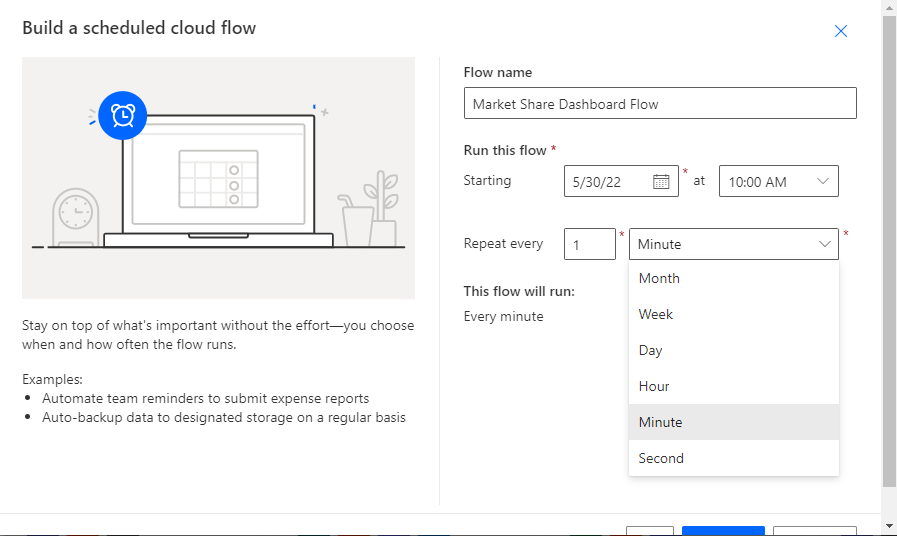
Step 3: Give a name for the flow and select the starting date and ending date for the flow with repetition frequency and select Month, Week, Day, Hour, Minute, and Second as per our need and select the Create flow.
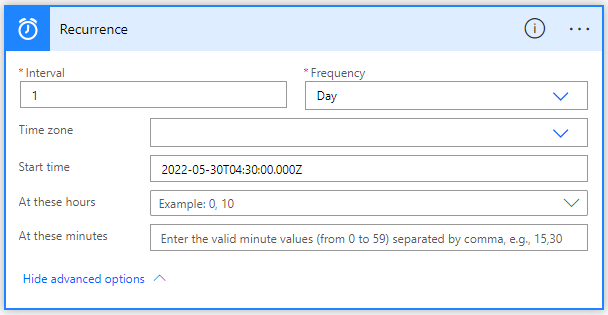
Step 4: In Recurrence, select Edit > Show advanced options and enter a value in At these hours and At these minutes to set a specific time for our flow to run.
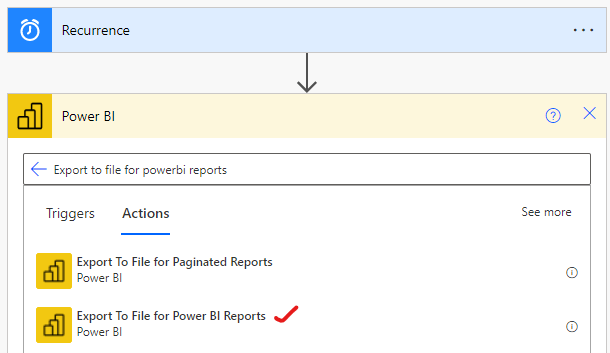
Step 5: Select New Step, choose Power BI and then Select Export to file for Power BI reports Action.
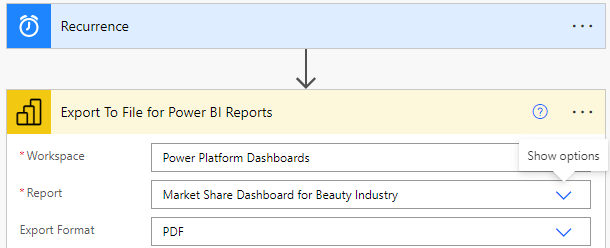
Step 6: In Export To File for Power BI reports, select the workspace and the dashboard which we want to export, and we can select the format we want to send our entire report like PDF, PNG, or PPTX. Other options are optional.
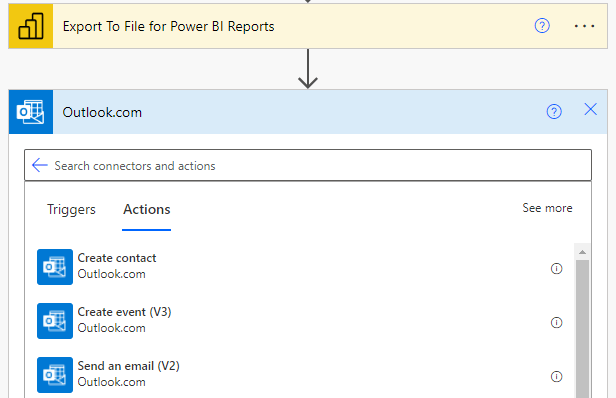
Step 7: Select New Step, search for Outlook or Office 365 Outlook and select Send an email (V2).
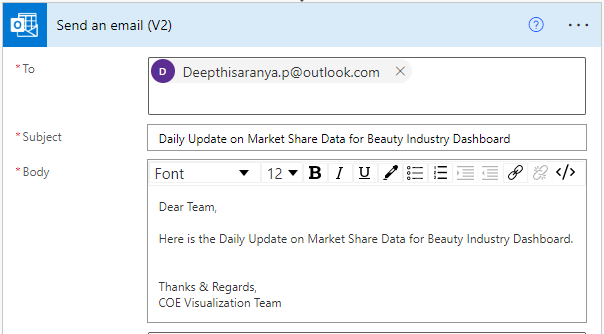
Step 8: In Send an email (V2), complete the To, Subject, and Body fields for your email. And in Advanced options, enter a name for our attachment in Attachments Name – 1 and add a file extension like PDF or PNG to the file name.
Step 9: In Attachment Content, select File Content to attach our exported Power BI Report.
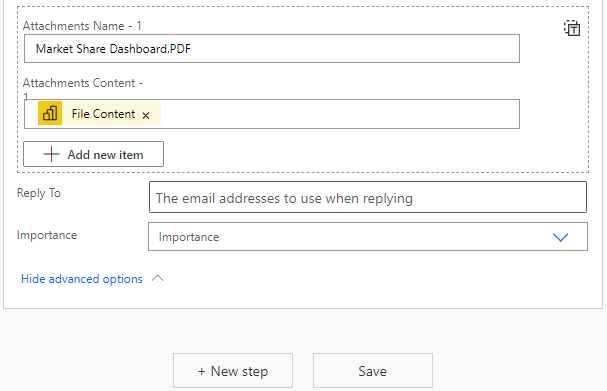
Step 10: Once we are done, select Save. Power Automate creates and evaluates the flow.
Test the Flow Manually
Click on the FlowChecker to check if there are any errors in the flow.
Once the Flow checker is checked, test the flow manually and run the flow.
After running the flow manually, you will get a Power BI PDF file with a message. According to our flow, you will receive a mail notification at the specified scheduled time.
Conclusion
Time series anomaly detection is a method to gain insights into business happenings that are unusual, and this method helps us to understand the focus areas and pain points. Using time-series anomaly detection techniques, a business user can now discover real-time deviations from a performance indicator’s regular behaviour. Detecting anomalies, whether positive or negative, is crucial since it leads to a better understanding of changes in business performance.
Similarly, the forecasting feature, which predicts future data based on existing data, can now be integrated instantly rather than going for a dedicated data science engagement. By utilising these predicted values, business stakeholders can make better decisions that drive growth and can plan more effectively to make smart decisions in order to keep their businesses competitive.
Power BI along with Power Automate, is certainly redefining the way anomalies are captured and can only improve from here. LatentView Analytics’ expertise, along with Power BI’s capabilities, is already developing multiple applications and is solving key business problems in this data-driven business world.


