

Introduction:
An EP&L account (Environmental Profit & Loss Accounting) is the monetary valuation of a business’s environmental impact that aids stakeholders’ journey towards sustainability by helping them understand their current implications. It is a measure of impact due to greenhouse gases (GHGs) emissions, water consumption, air and water pollution, land use, and waste production along the entire value chain. An EP&L account helps to make the many environmental effects of a company’s activities transparent. These impacts are then converted into monetary values to quantify the use of natural resources. This enables the brand to use its supply sources better, identify the most appropriate technologies, create ideal processes, and direct its sustainability strategy using the EP&L.
Since the fashion industry is extraordinarily complex and includes many different activities spread across the globe, translating all the complex EP&L accounting information can be challenging. Here is our attempt to create a business intelligence report to help users understand the environmental impacts of the brand at a granular level.
Choice of Visuals:
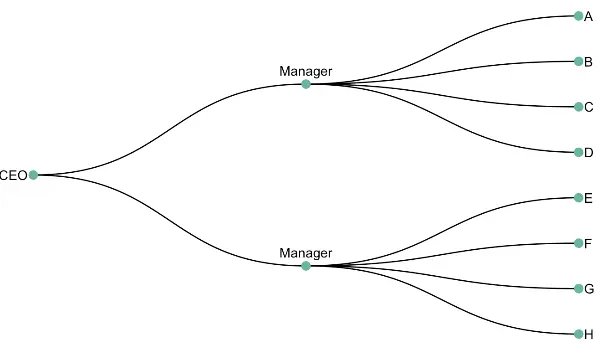
Dendrogram Chart: We use dendrogram charts to cluster data and group related items. They help explore and understand data sets with many variables. Dendrogram charts are often used in data mining and machine learning to find patterns in data.
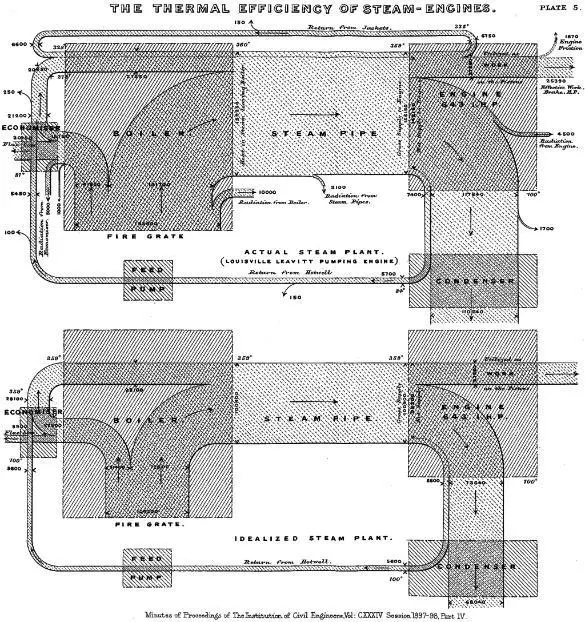
Sankey Chart: We use a Sankey chart to visualize flows. It is named after Irish Captain Matthew Henry Phineas Riall Sankey, who used this type of visualization to depict the steam engine’s energy efficiency in 1898. Sankey charts are used to show how money flows through an economy or how a nation consumes energy. The chart’s arrows’ width is displayed in relation to the flow quantity.
Data Preparation:
Tableau Prep is a free add-in for users with a Tableau creator license. It automates the process of collecting and cleaning your data at scale without writing a single line of code. In addition, since it combines the power of MS Excel and the data prep functionality from Tableau Desktop, you can combine multiple data sources, remove outliers, audit, and perform data aggregations.
Since tableau out of the box does not support our choice of visuals, we had to add additional data points to our dataset. This process is called data densification and is a customary practice followed by data professionals to build custom visualizations in tableau. We have used Tableau Prep to prepare our data for analysis. You can learn more about this process here – Dendrogram Chart, Sankey Chart.
Data Visualisation:
We have used a dendrogram chart to show the brand’s global environmental impact. We have classified the countries into three regions: Europe, Asia, and the Rest of the World. This visual helps the user compare the brand’s relative impact across different countries and identify the countries and regions where the brand has the most impact.
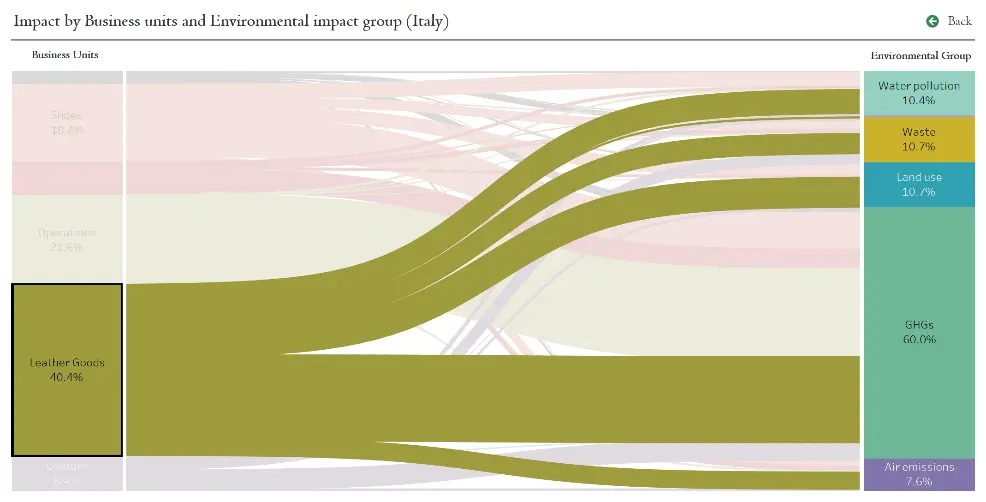
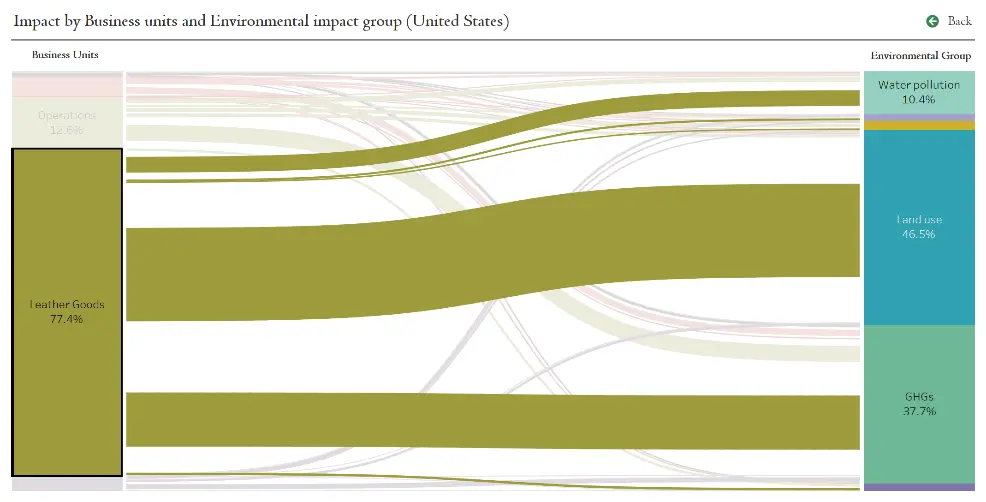
The Dendrogram chart is accompanied by a Sankey chart, which the user can access by selecting a country in the main visual. The Sankey chart is used to show the environmental impact of the brand across different business units. This visual helps the user understand how different business units contribute to each environmental category.
Data Analysis:
Understandably, Italy contributes to around 20% of the overall environmental impact caused by the brand operations. China and the United States stand second and third overall in terms of environmental impact. It is important to notice that these countries contribute the most in their respective regions and close to 44% of the overall impact caused by the brand.
Across all regions, leather goods are the major contributor among all business units while contributing to water pollution, land use, and GHG emissions the most in the order mentioned. After performing the same analysis for Italy, we have observed that leather goods and operations contribute most to the brand’s environmental footprint. Likewise, most activities contribute to the emission of GHGs.
In the United States, leather goods are a major driver of the brand’s environmental impact while contributing similarly to land use and GHGs.
Conclusion:
EP&L data exploration and visualisation helped us to gather valuable insights about the brand’s environmental footprint across various geographical regions, business units, and impact categories. We have observed that the leather goods and shoes business units drive the brand’s environmental impact while mostly contributing to GHGs emissions and pollution related to land use. If the brand can reduce Leather consumption by 10% using synthetic materials, it will result in reduction of its environmental footprint value of €13M to €18M a year based on data from the last three years.
As former French president, François Hollande famously said, “We have a single mission: to protect and hand on the planet to the next generation.” It is encouraging to see that some brands have already started auditing their environmental footprint and taking necessary steps to move towards greater sustainability. Hopefully, more brands will do the same so that all future generations will get to live on the same beautiful, diverse, nurturing, awe-inspiring planet as we do right now.
Link for Tableau Visualisation – Dashboard


