

Imagine a world where businesses can foresee trends in advance. This would then help them to predict their sales/revenue and make strategic decisions ahead of time.
Hence analysts often scramble to build a forecasting model. However, there are certain limitations and challenges in the current forecasting models which are not insightful enough to make fast business decisions.
Identifying Gaps in Forecasting to Make it Actionable
While it is important to know that in the next one week, sales will decline by X%, this is not yet actionable since the insight is at a high level.
A forecasting model needs to answer the following questions:
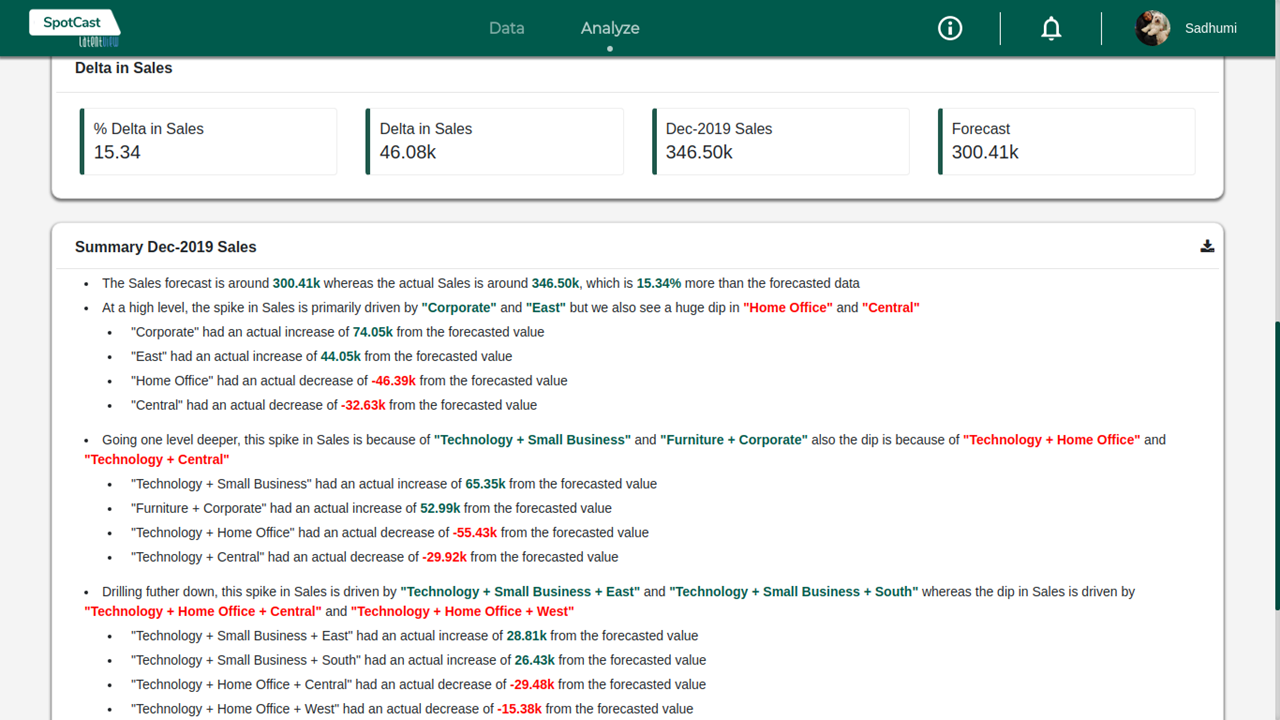
- What is causing the change in trend? Why will sales decline by X1% in the south region, mainly in product category P1? What is the cause of an X2% increase in product category P1 in the East? The causes of upward and downward trends need to be answered by a forecasting model.
- To what extent are the dimensions changing? It is important to understand the magnitude of change at granular levels to act on. The model needs to quantify the change in each variable in order the help the business prioritize the action to be taken.
- Are the results reliable and significant? The model needs to be tested and validated across all possible scenarios to ensure consistency of results and higher precision. Some of the testing parameters would include checking for consistency of Model Significance and MAPE (Mean Absolute Percentage Error) values across various dimensions.
Another important factor to consider is the model building time. Building complex models take immense time and effort and need to tie all pieces of information together. A model needs to be built in a shorter time frame to keep up with the changes in trends.
Processing the trends across all business KPIs and mastering the insights from them is always a time- consuming task. It concerns complications with multiple touchpoints. An anomaly detection engine helps in identifying true drivers of the KPIs by considering the forecast as well as the previous data
points at a multi-dimensional stratum.
Spotcast: Spotting Anomalies by Automated Forecast
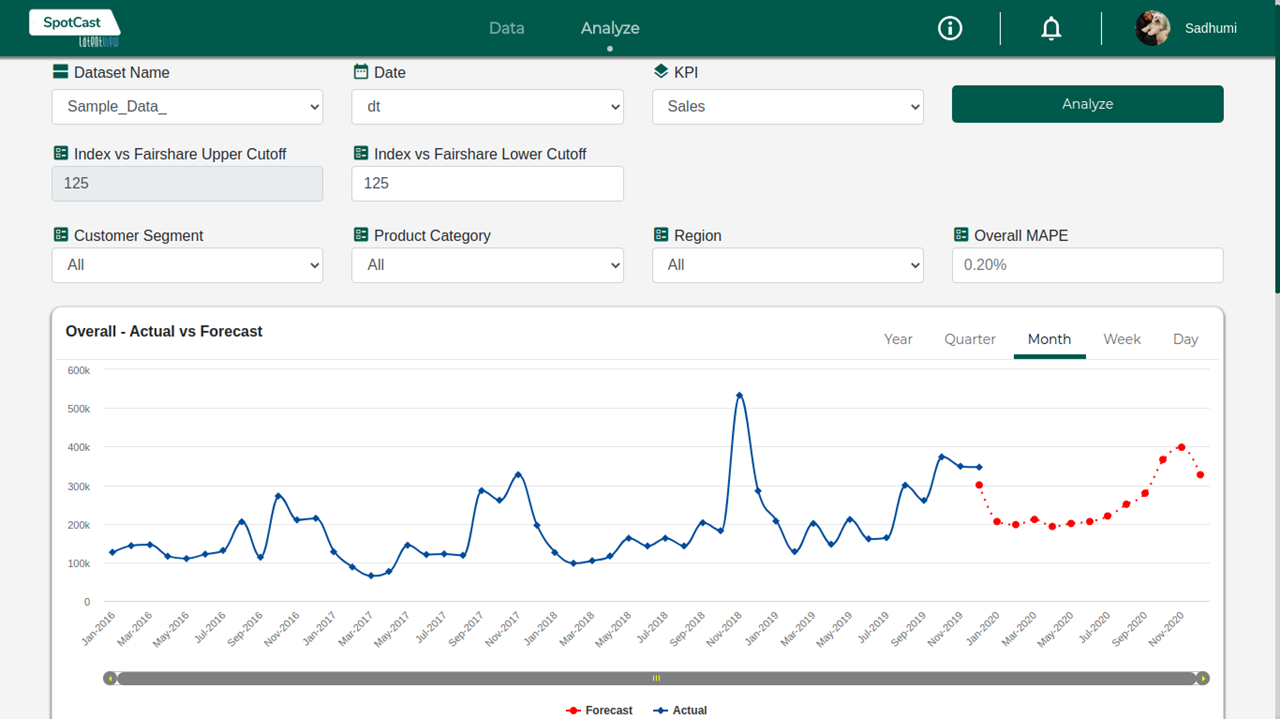
LatentView Analytics’s in-house tool called Spotcast helps in end-to-end automated forecasting to understand business trends and spot anomalies from a given time-series data. It alerts the user when there is a deviation in the expected trend by comparing the actual and forecast for the recent date.
Let us take a look at how Spotcast works.
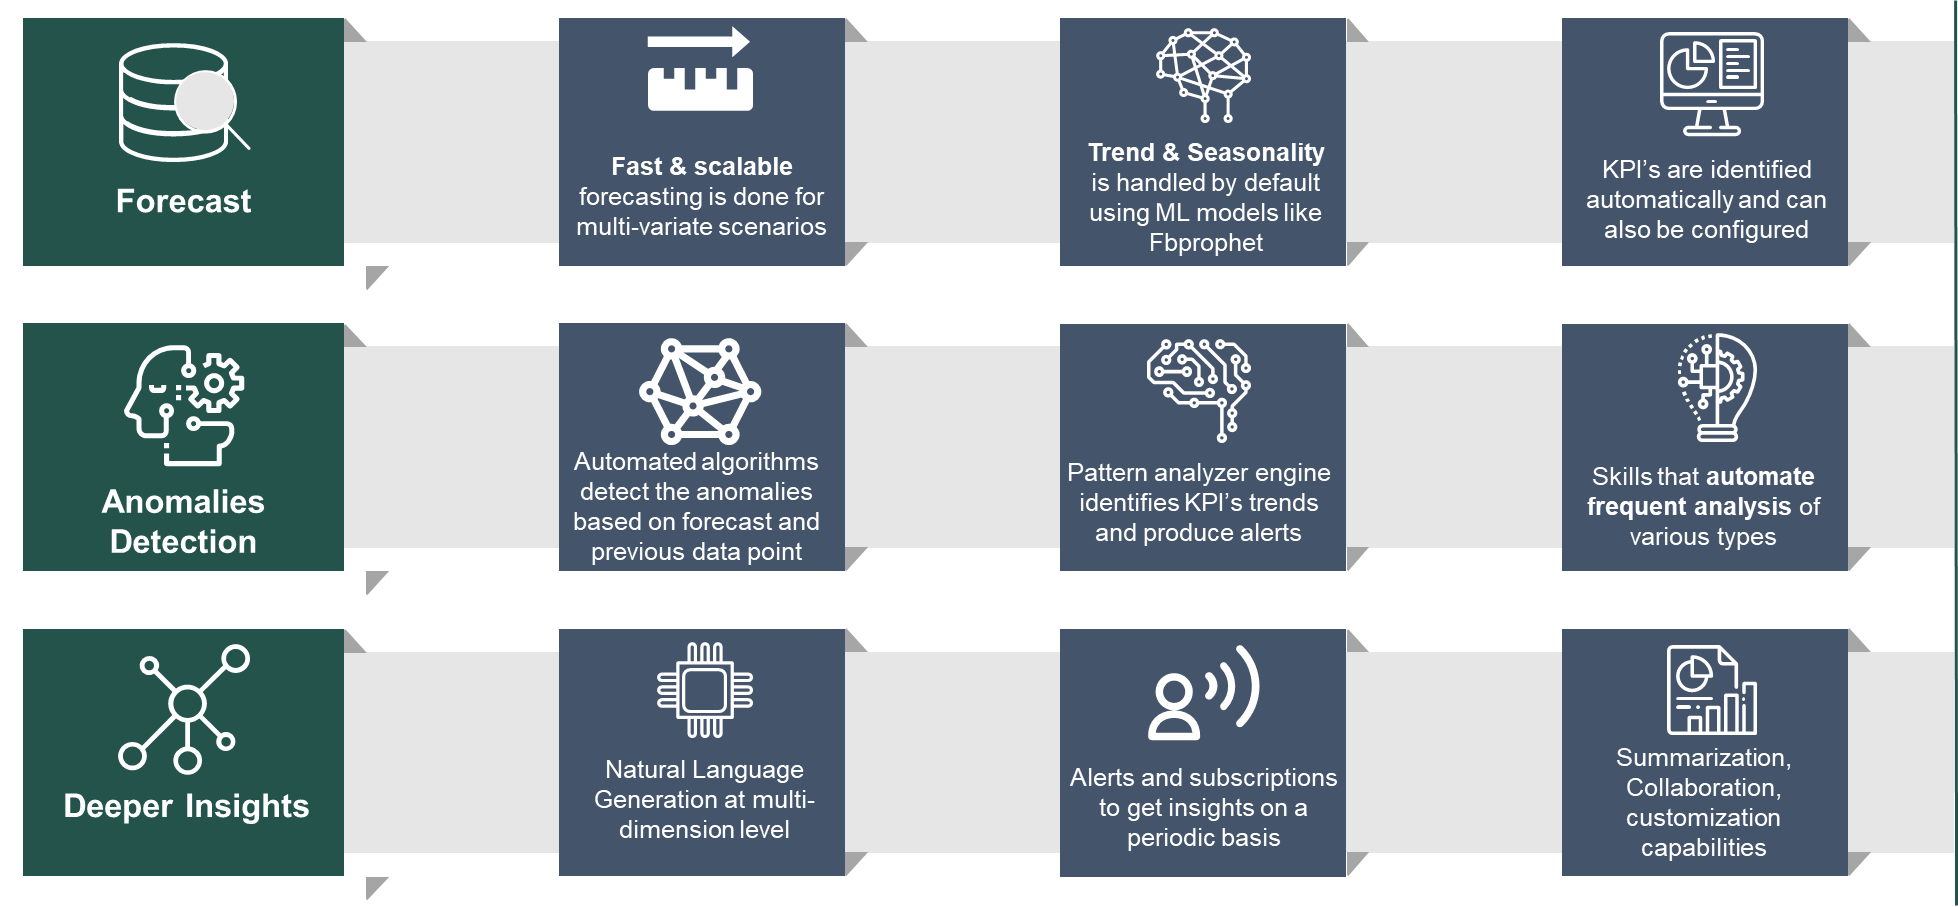
- Automated ML algorithm runs the time series forecasting for any user-selected KPI across two dimensions. It forecasts the trend line for the latest month and draws out for the next few days/weeks/months.
- A comparative summary is done among the forecasted and the actual numbers to determine the anomalies based on the forecast and actual data points for multivariate scenarios.
- Provides profoundly perceptive insights using NLP Narrative dynamically at multivariate levels for any given datasets. This reduces time and effort compared to a manual way of interpretation.
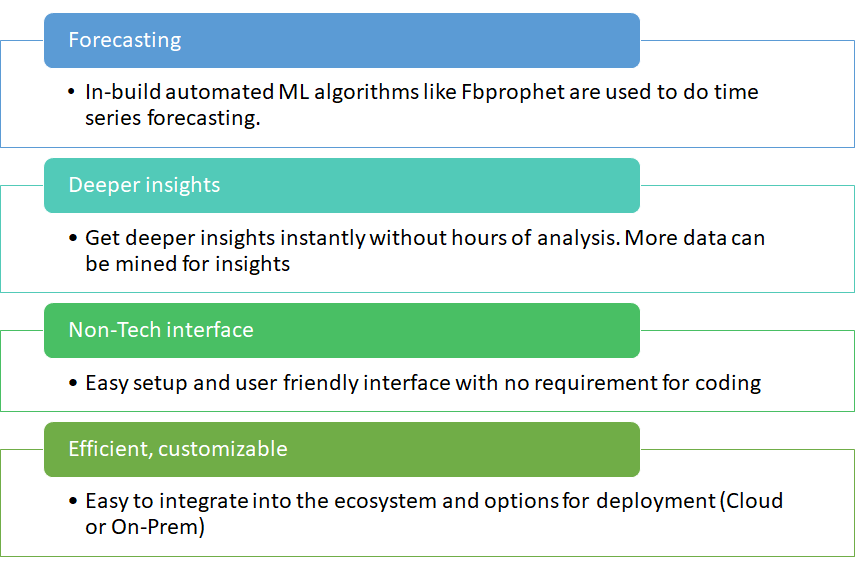
Benefits of using Spotcast
- Business users can have a visual representation of the trends and forecast across different segments, product categories, regions, and other dimensions of interest.
- There will be improved accuracy with a focus on seasonality and trend with multiple forecasting models for the best MAPE.
- The analysis is automated with main callouts into the reason for deviations in actual Vs forecast, drill down into the reason for increase or decrease.
- The tool makes generating insights easier due to dynamic insights. ~15 insights are generated on an average which can be directly actionable.
- It greatly improves operational efficiency for analysts by reducing the man-hours spent on the forecasting model by one-third.
Conclusion
With the help of Spotcast, you can immediately start spotting anomalies in your business, identify gaps in expectation and actual trends, and know the root cause of an anomaly leading to an increase or decrease in the KPIs. This will help you understand the benchmarks’ changes by trend and help set goals.
Get in touch with us to know more about Spotcast.


