
The COVID-19 pandemic has impacted several industries, and the retail sector is one of them. The industry saw the existing thin line between e-commerce and brick-and-mortar retail blur more than it has in the last few years. In the US, the online share of retail sales has increased from 15.8% in 2019 to 21.3% in 2020. This increase has accelerated the shift from physical stores to digital shopping by roughly five years
Consumer behavior in times of crisis
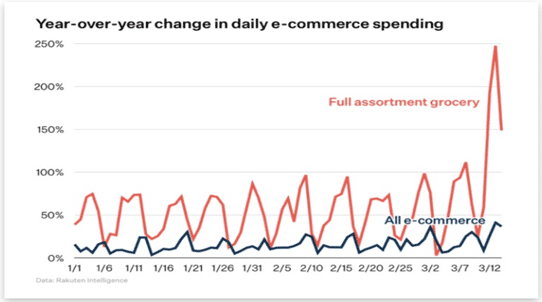
At the beginning of the pandemic, when panic buying was at its peak, several brick and mortar stores saw essentials like bread and toilet papers go out of stock which propelled many people to shop online for these products. As ‘Out of Stock’ is a major influencing factor for customer dissatisfaction, consumers shifted to online shopping, which offered them several choices. The graph below shows that e-commerce for groceries soared in the second week of March when several products were out of stock in stores.
The inevitable decline in revenue for departmental stores due to the increasing trend in online shopping has seen several retailers move to omnichannel fulfillment. In addition to in-store shopping, Walmart, Target, and several other retail stores now have pick-up and home delivery options when consumers shop online.
In a survey conducted by PYMNTs, around 52% of the consumers said they would not go back to shopping for groceries in-store, and 60% said that they will continue shopping online for other goods the same way as they are now. As online shopping is here to stay even post the pandemic, customer retention becomes very important. With the vast majority of options that are available online, customers are unlikely to revisit the same website to purchase a negative experience.
An aspect of in-store shopping that consumers miss is the sudden joy of looking at a product in the grocery store which is not a part of their list and immediately changing their mind on what to get. This problem can be alleviated to an extent with the help of Recommendation Systems.
Recommendation systems give users a sense of personalization when they visit the website; this gives users a better experience while shopping online and helps in customer retention. A consumer survey found that shoppers appreciate personalized shopping experiences too; in fact, 51% of shoppers say a homepage that shows products they are looking for or might be interested in is helpful.
Graph database for an efficient recommendation system
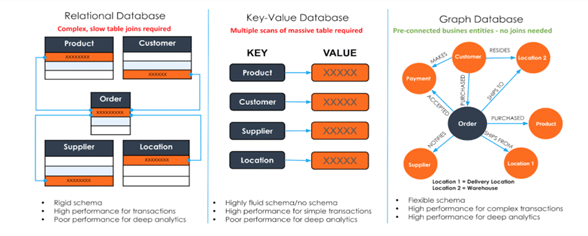
Most retailers have their data stored in traditional relational databases. The biggest challenge in today’s master data management system is that all the information is present in different silos (examples – one for customers, one for products). Since the data is stored in different tables, joins are required to find relationships between them. As the data grows, it becomes computationally intensive and time-consuming to perform these operations. In today’s world, where change is the most common phenomenon, the ability to add only structured data or changing the schema to add new data proves to be an Achilles’ heel.
On the other hand, graph databases are the ideal solution for finding and analyzing relationships between data. Graph databases store data points as key-value pairs and also stores the relationships between them. For a highly complex dataset like those used for creating a recommendation engine, a graph database is said to work a million times faster than a traditional database.
A graph database leverages several concepts that make it the most sought-after tool for creating recommendation systems. A company usually has data stored in several different types of databases and places. A graph database can use these pre-existing sources to create a new graph that helps you identify relationships between them that you would have never thought of otherwise. It makes a 360-degree view of the customer by using information from all the different repositories, giving us a better understanding of the customer, thereby improving customer satisfaction and experience. Its ability to transverse data at many different levels of depth in real-time and connect new data on the fly is beneficial for creating real-time recommendations.
The recommendation systems in the graph database can be created in several ways. It could be created by uncovering customer segments and advocate products that others in the same segment bought (collaborative filtering) or endorse something similar to the product category they recently shopped/viewed (content-based filtering). Another technique called the hybrid filtering technique combines both to reduce limitations and provide a more accurate recommendation.

Creating an excellent personalized recommendation system by leveraging customers’ data from their multi-channel shopping experience (stores, mobile app, website) is crucial. In the future, the relevance of the recommended products can be improved by integrating Machine Learning techniques that help understand customer behaviors. Such recommendations can, in turn, increase revenue and create higher engagement.
Download the infographic on How Personalized Recommendation Systems are Transforming the Online Retail Industry here.
Get in touch with us or mail us at marketing@latentview.com to know how you can use Graph Database to add value to your business.