Introduction
Self Organizing Maps (SOM) or Kohenin’s map is a type of artificial neural network introduced by Teuvo Kohonen in the 1980s.
A SOM is an unsupervised learning algorithm trained using dimensionality reduction (typically two-dimensional), discretized representation of input space of the training samples, called a map. It differs from other ANN as they apply competitive learning and not the error-correction learning (like backpropagation with gradient descent). They use a neighborhood function to preserve the topological properties of the input space to reduce data by creating a spatially organized representation, and also helps to discover the correlation between data.
Although SOM has been initially proposed for data visualization, it has been applied to different problems, including a solution to the Traveling Salesman Problem (TSP).
Applications
- Dimensionality reduction and data visualization: In terms of dimensionality reduction, Principal Component Analysis (PCA) is actually one of the most popular tools and has been broadly used. Compared to PCA, SOM has an advantage in maintaining the topological (structural) information of the training data and is not inherently linear. Using PCA on high-dimensional data may cause a loss of data when the dimension is reduced to two. If the target data has a lot of dimensions and every dimension is equally essential, SOM can be very useful over PCA.
- Seismic facies analysis for oil and gas exploration: Seismic facies analysis refers to the interpretation of facies type from the seismic reflector information. It generates groups based on the identification of different individual features.
These methods find an organization in the dataset and form organized relational clusters. However, these clusters may or may not have any physical analogs. A calibration method to relate SOM clusters to physical reality is needed. This calibration method must define the mapping between the groups and the measured physical properties; it should also provide an estimate of the validity of the relationships.
- Text Clustering: Text clustering is an unsupervised learning process, i.e., not dependent on the prior knowledge of data, and based solely on the similarity relationship between documents in the collection to separate the document collection into some clusters.
Text clustering’s important preprocessing step is to check how the text can be shown in the form of the mathematical expression for further analysis and processing. The Common method is Salton’s vector space model (Vector Space Model, VSM).
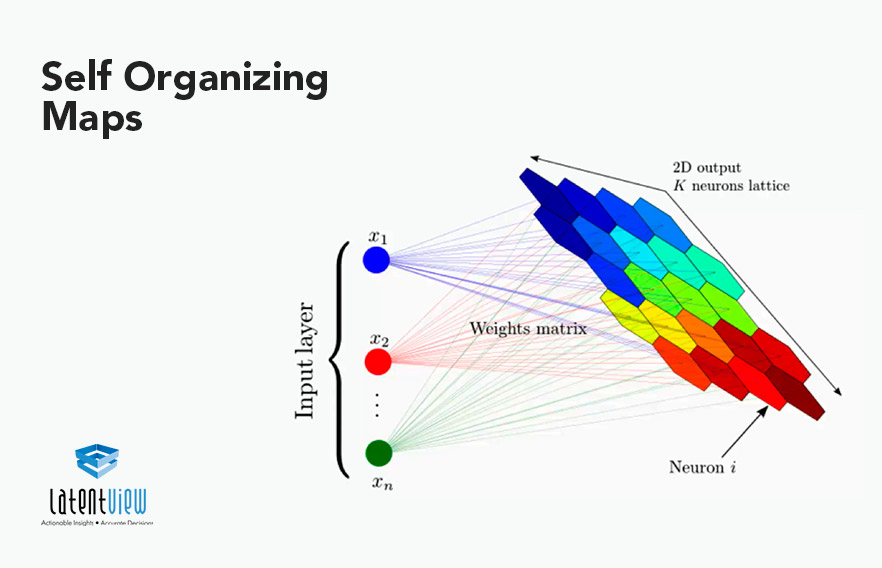
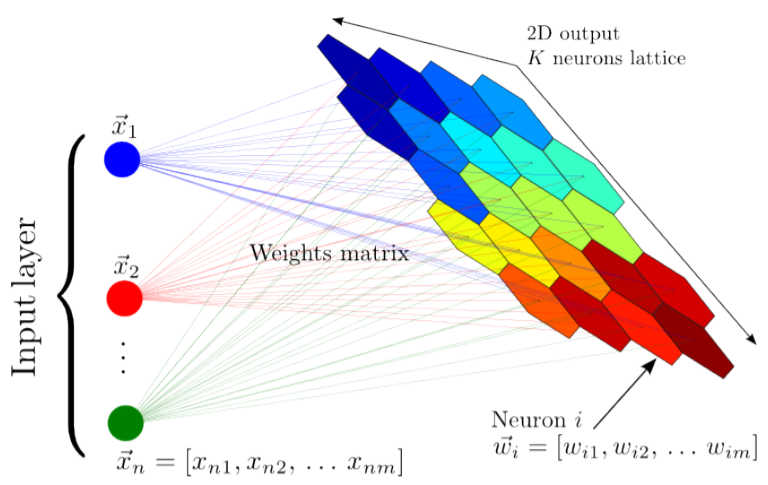
Self Organizing Maps architecture
Self-organizing maps consist of two layers, the first one is the input layer, and the second one is the output layer, also called a feature map.
SOM can integrate multi-modal input vectors and can extract relations among them in a 2-dimensional plane. SOM can also be used for the clustering of unlabeled data or classify labeled data with labeling the output units after learning. Unlike other ANN types, SOM doesn’t have activation functions in neurons, and we directly pass weights to the output layer without doing anything.
What really happens in SOM?
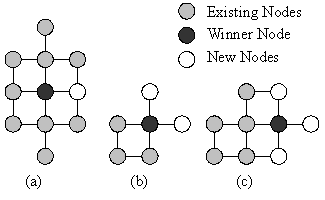
Each data point in the data set competes to get recognition for representation. SOM mapping steps start from initializing the weight vectors. From there, a sample vector is selected randomly, and the map of the weight vectors is searched to find the weight which can best represent that sample. Each weight vector maintains neighboring weights that are close to it. The weight that is selected is rewarded by being able to become more like that randomly selected sample vector. The neighbors of that weight are also considered by being able to become more like the selected sample vector. This allows the map to form different shapes. Most generally, they have square/rectangular/hexagonal/L shapes in the 2D feature space.
The Algorithm
The learning procedure of a SOM is described below.
1. Let wi,j(t) be the weight from an input layer unit i to a Kohonen layer unit j at time t. Wi,j is initialized using random numbers.
2. Let xi(t) be the data input to the input layer unit i at time t; calculate the Euclidean distance dj between xi(t) and wi,j(t)
3. Search for a Kohonen layer unit to minimize dj , which is designated as the best matching unit.
4. Update the weight wi,j(t) of a Kohonen layer unit contained in the neighborhood region of the best matching unit Nc (t) using (2), where α(t) is a learning coefficient.
wi,j(t+1) = wi,j(t) + α(t) ( xi(t) – wi,j(t) )
5. Repeat processes 2–4 up to the maximum iteration of learning.
Best Matching Unit is a technique which calculates the distance from each weight to the sample vector, by running through the entire set.
Self organizing maps training
As mentioned before, SOM doesn’t use backpropagation with SGD to update weights; this type of unsupervised ANN uses competitive learning to update its weights. Competitive learning is based on three processes :
- Competition
- Cooperation
- Adaptation
Let’s look at the process in detail-
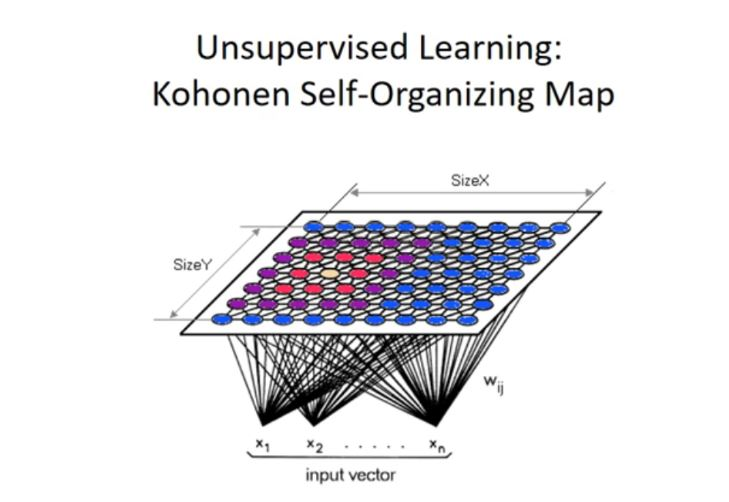
- Competition :
In the below example, each neuron of the output layer will have a vector with dimension n. We compute the distance between each output layer neuron and the input data. The neuron with the lowest distance will be the winner of the competition. The Euclidean metric is commonly used to compute distance.
- Cooperation :
We will update the vector of the winner neuron in the final process (adaptation) along with its neighbor.
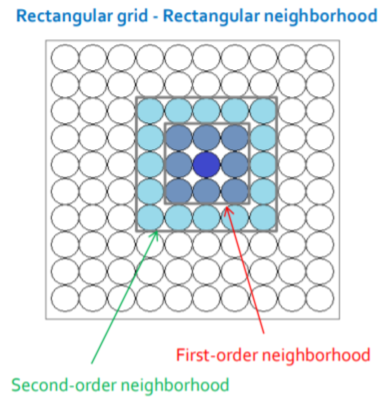
How do we choose the neighbors?
Selecting neighbors using neighborhood kernel function, and this function depends on two factors: time and distance between the winner neuron and the other neuron.
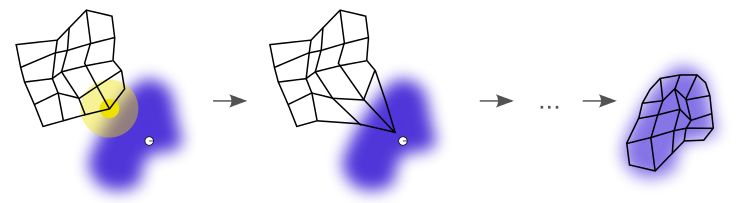
- Adaptation :
After selecting the winner neuron and its neighbors, we compute the neuron to update. Those selected neurons will be updated but not the same update, more the distance between the neuron and the input data grow less we adjust it like shown in the image below:
Pros of Kohonen Maps
- Data is easily interpreted and understood (reduction of dimensionality and grid clustering)
- Capable of handling several types of classification problems while providing a useful, and intelligible summary of the data.
Cons of Kohonen Maps
- It does not build a generative model for the data, i.e., the model does not understand how data is created.
- It doesn’t perform well when using categorical data, even worse for mixed types of data.
- The model preparation time is slow, hard to train against slowly evolving data
SOM Clustering Method For Large-Scale Text Clustering
- Conventional data clustering techniques often perform unsatisfactorily for extensive text collections due to 3 factors:
- There are large numbers of documents to be processed;
- The dimension is huge for text clustering;
- The computation complexity is very high. So it is vital to improving the computation speed.
- As correlation computation is very crucial for text clustering and has much impact on clustering efficiency. Each document is coded as the collection of keywords extracted from the original record and then fed as input to SOM. In contrast, each output layer node of SOM is coded as a numeric vector as that of most Kohonen Networks.
- In order to directly separate documents into different groups, ring topology is adopted as a SOM structure. Thus the number of groups can be an integral value. Like Kohonen Networks, it consists of two layers, an input layer, and an output layer; each node in the output layer corresponds to one cluster. Only neurons need to be represented as high-dimension vectors, whereas the document will be coded as indexes of keywords.
Conclusion
SOM is an ANN-based method that projects data into a low-dimensional grid for unsupervised clustering. The input nodes are the ‘n’ features, and the output nodes are the ‘m’ prototypes. The revised SOM is applied to various standard input data sets, and the experimental results prove that the revised SOM is better than the conventional SOM. It is also shown that revised SOM reaches to the outlier’s data, where conventional SOM could never reach. The results have shown that the modified SOM preserves the topology of the input dataset more efficiently and correctly. The modified SOM has a much lower topographic and quantization error, which is desirable.
Finally, SOM’s distinct training architecture provides ease for the realization of parallel clustering and incremental clustering.