
The most common way of measuring the impact of a marketing campaign is to create a control group of customers who do not receive the campaign and compare them with those who are targeted for the campaign, the target customers. For an unbiased comparison, the two sets of customers must be identical across the factors on which they were segmented, otherwise it would not be an apples to apples comparison.
However, in some circumstances, it might not be possible to have a dedicated control for certain campaigns. For instance, when the total sample population is too small to split into a target and control. In cases like this, it becomes difficult to measure the business impact- increase in sales, customers etc.- that can otherwise be attributed to a campaign. This is a huge problem for most marketers who are under pressure to demonstrate ROI on their marketing spends.
Here are some techniques that can be used to measure the impact of campaigns, even in the absence of a control cell.
Pre vs. Post Analysis
As the name suggests, the pre vs. post analysis technique involves comparing the performance of the target customers before (pre) and after the campaign (post). Let us walk through an example.
There is a popular cab service provider who is offering a 50% discount on cab fare if a customer uses a virtual wallet to make the payment. The objective of the campaign is to increase the number of customers using the virtual wallet. If we were to apply the pre vs. post technique to measure the impact of this campaign, the average number of rides per customer that were paid using the virtual wallet would be a primary metric. We would then compare this metric calculated for one month prior to the launch of the campaign with the same metric calculated for one month after the campaign has ended.
This is one of the easiest techniques to use. However, the disadvantage of this technique is that it doesn’t take into consideration the seasonality that the metric might follow. For instance, the average number of rides per customer that were paid using the wallet could have some natural spikes and troughs during specific seasons and we might wrongly attribute the difference in the pre and the post metrics to our campaign.
This Year vs. Last Year
This technique is one of the most commonly used methods to measure the impact of seasonal marketingcampaigns. For example, consider a retail outlet that has identical shopping offers in the month of May every year. The growth in sales of this particular store can be measured by comparing the average sale in May of last year with the average sale in May of this year.
Although this technique is not affected by seasonality, the disadvantage here is that it does not account for data trends. There might be a natural increase YoY for any business and in an ideal scenario, this natural increase should not be attributed to the campaign.
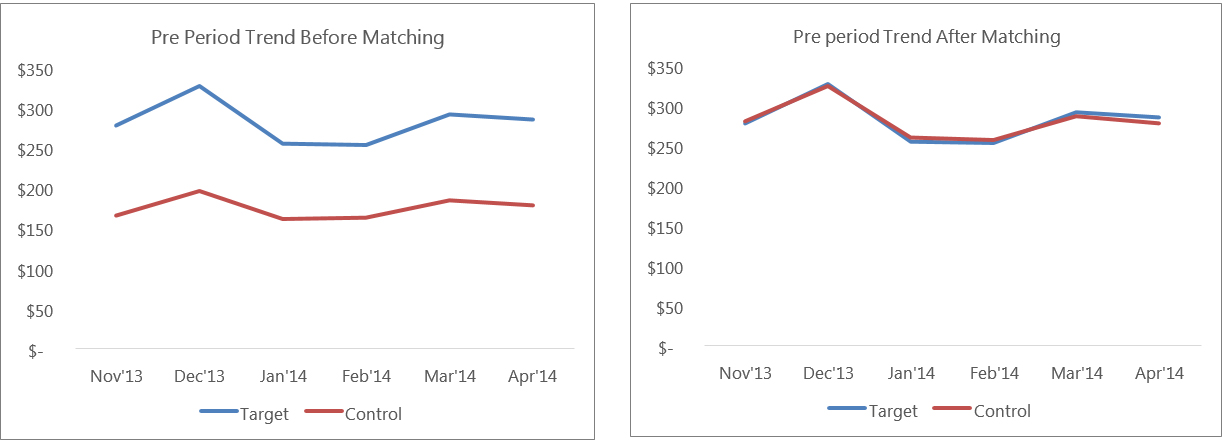
Difference of Difference (DoD) by Time Series Matching
The difference of difference (DoD) technique involves creating a ‘pseudo-control’ group and then measuring the impact of the campaign. Time series matching is used to choose the pseudo-control from a generic pool of customers by matching their behavioral pattern (for example sales) with that of the target customers, before the campaign, over a specific period of time. In DoD, the difference in sales between target and control cells before the launch of the campaign (pre) is compared with the difference in sales between Target and Control after the end of the campaign (post). The difference between the differences in the pre and post period helps measure the actual impact of the campaign.
The sales trend of customers before and after matching would look something like what has been depicted below:
Propensity Matching
The propensity matching technique is used to select a group of customers from the ‘non-targeted’ group to form the control group, which is similar to the target group based on the propensity scores.
The propensity scores are the probability scores that indicate how likely a customer would be responding to the event. Based on the customers’ pre-period activity, propensity scores are generated using logistic regression algorithm (Event = 1 for all target customers and Event = 0 for all non-targeted customers).
For example: Let’s say a Customer T in the target group has a probability score of 0.931. From the control group, we have customers C1 of 0.930, C2 of 0.934, C3 of 0.939. The matching algorithm compares Customer T with all the customers in the control group. The customers from the non-targeted group having probability scores of within a certain threshold of 0.931 (say +/- 0.001) would be selected as a control. Based on this, C1 would be chosen as a synthetic control customer for the target customer T.
>Now, for each target we will have a corresponding control customer. The activity of the target group is compared with the activity of the control during the campaign period.
These techniques allow us to choose pseudo-control groups and are therefore more accurate. However, these techniques can be time consuming and resource intensive to run.
In summary, while control groups are a powerful analysis tool for measuring campaign effectiveness, in the absence of one, the above mentioned techniques could be used to establish the impact a campaign had on business performance.
With inputs from Saranya Ravichandran, Prathamesh Dalvi, Niveditha Murali and Santhosh Mohan