Introduction
The NBA offseason is a wild time. There is a ton of volatility from players moving between teams and raw rookies coming in from college to coaching changes and entire front office shakeups. These moves keep the basketball universe on edge. After all, these moves are executed by teams with the ultimate goal of winning an NBA championship.
While many pundits and bookmakers tout their picks for the champion during the offseason itself, I have a different idea in mind.
A better time to predict champions would be before the playoffs begin. A full season of 82 games grants enough time for teams to build chemistry and improve their rosters through mid-season trades. With this thought process in mind, I set about trying to build a machine learning model that could accurately predict who would win the championship.
Data Overview
The dataset consists of the following data for each team dating all the way back to the 1979–80 season. The dataset is of size 1104 x 12.
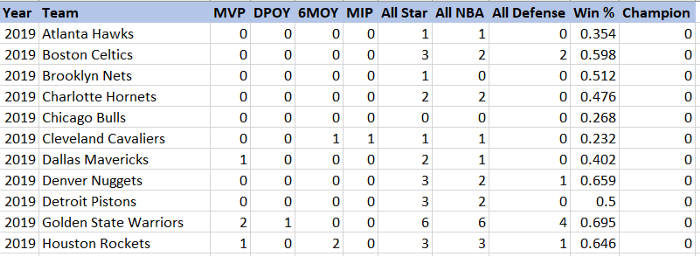
We can classify the columns shown above into one of four categories:
- Team Information: Year and Team keep track of the individual rows.
- Team Composition Strength: The columns from MVP — All Defense measure team strength purely based on its roster. For example, the 2019 Golden State Warriors had 2 MVPs on their roster (Steph Curry & Kevin Durant), so the value under their MVP column is 2.
- Team Performance Strength: Win % conveniently aggregates several quantifiable performance metrics (Offensive Rtg, Defensive Rtg, etc.) as well as intangibles (Team Chemistry, Synergy).
- Champion: The million-dollar question — whether a team won the title or not. This field is the target variable for the machine learning model.
Unbalanced Dataset
Before we can go ahead and build a classification model on this data, we need to understand the problems caused by using an unbalanced dataset.
Well, what is an unbalanced dataset? In simple terms, an unbalanced dataset is one in which the target variable has more observations in one specific class than the others.
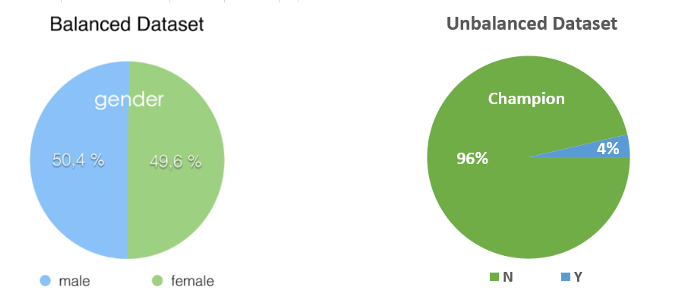
In our case, we see that the number of records where teams haven’t won a championship is almost 25 times that of where teams have won one.
Using the training set as is would result in an inaccurate model because the algorithm receives significantly more examples from one class (‘Not Winning’) which causes it to be biased towards that particular class. It does not learn what makes the other class differentand fails to understand the underlying patterns that allow us to distinguish classes.
Balanced Random Forest
While there are multiple statistical methods (under-sampling majority class, over-sampling minority class, etc.) to deal with an unbalanced dataset, Python, fortunately, provides a library to deal with this specific problem.
The library imbalanced-learn offers several re-sampling techniques as well as ensemble classifiers such as Balanced Random Forest to deal with unbalanced datasets. Balanced Random Forest tackles this problem by down-sampling the majority class such that the classification tree runs on a subset of the training data which is balanced.
Now, after we generate training and test sets by performing a 75/25 split on the original dataset, we can run the Balanced Random Forest classifier on the training set.
Feature Importance
After training the Balanced Random Forest classifier on the training set, we can see which features contribute most towards winning a championship.
A method of the Balanced Random Forest classifier called feature_importances_ quantifies the importance of features. A higher value indicates that this feature is more important.
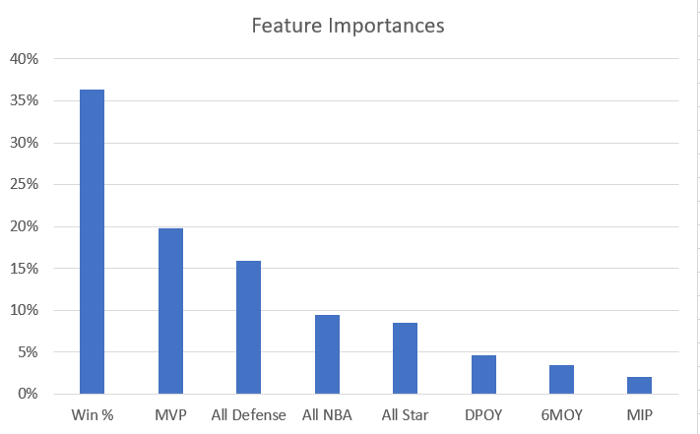
We can see that the most critical factor is Win % which is a measure of how well the team has performed over the season. The next factor is having an MVP on their team. After these two factors, we see the best offensive and defensive players in the league contribute towards winning it all as well.
In a nutshell, a superstar loaded team that wins many games is more likely to win a championship compared to a team that wins the same number of games but has no superstars.
Evaluating the classifier
Now that we have trained the classifier and seen which features are most important, it is time to check if the classifier is any good.
A very intuitive way of checking the performance of any classifier is by its ROC (Receiver Operating Characteristic) curve and its AUC (Area Under Curve). We can also compare these parameters with that of a baseline model.
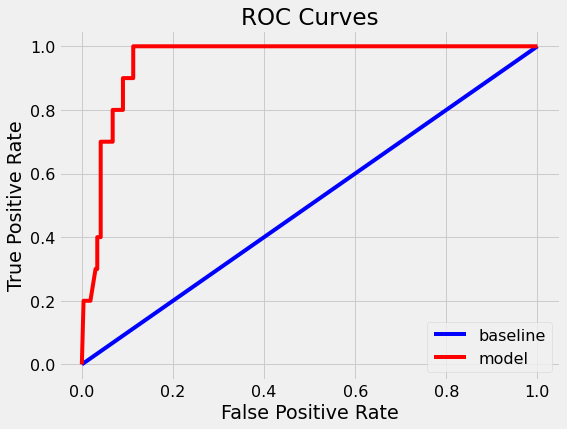
Without diving into the theory behind ROC curves, it suffices to say that a classifier performs better if it has higher AUC. In this case, the baseline model has an AUC of 0.5 while our model has a much higher AUC of 0.95.
We can also look at the confusion matrix to calculate Precision and Recall.
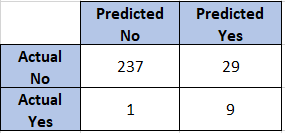
Using the confusion matrix, we get 0.9 as Recall and 0.24 as Precision. The Precision of the classifier is low because it identifies multiple potential championship-winning teams. This behaviour resembles real life where we pick more than one team to win it all at the end of the regular season. So we need not try to optimize Precision.
Predictions
Now that we have completed the model building and its evaluation, let’s dive into what the model predicts.
Firstly, let’s look at how the winning probabilities vary for the teams that actually won the title over the years.
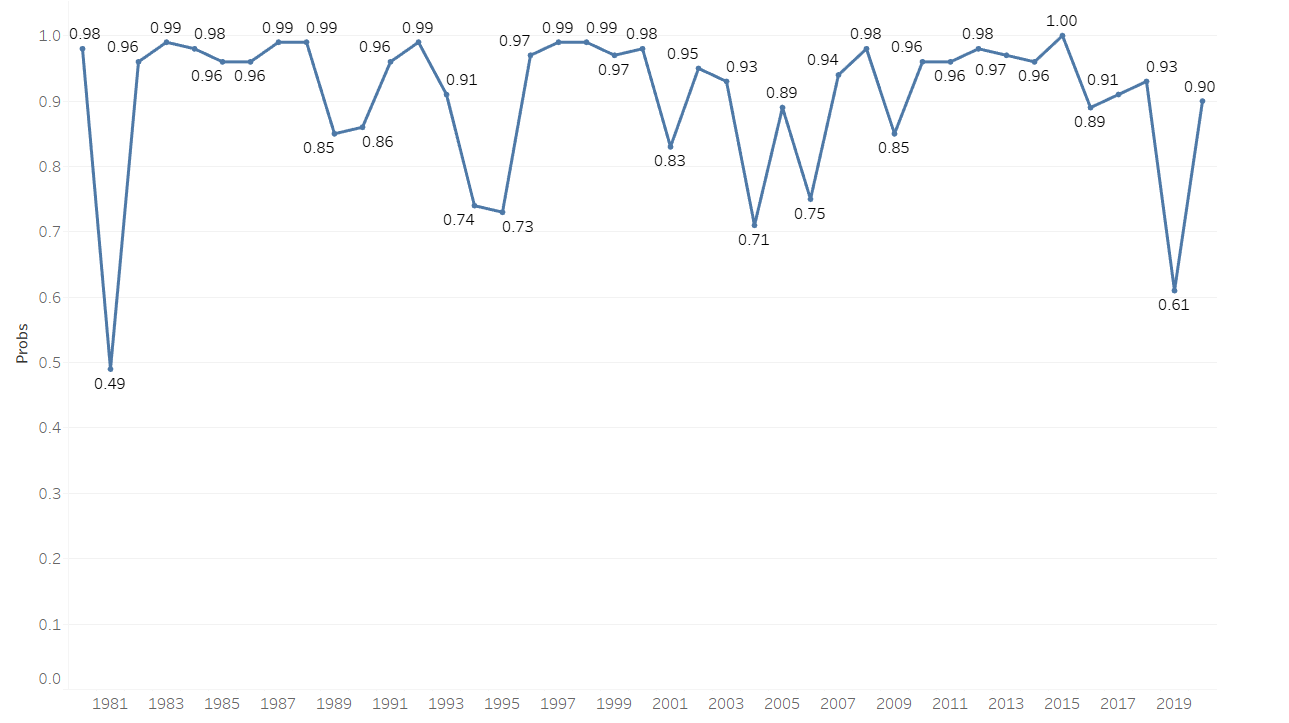
We can take away some fascinating stuff from this plot:
- Teams that went to win it all have a median winning probability of 0.96 — implying that great teams with a lot of wins at the end of the regular season have a very high chance of winning the championship.
- A glaring outlier to this trend is the 1981 Boston Celtics. This team consisted of very young soon-to-be Hall of Fame superstars in Larry Bird, Kevin McHale and Robert Parish. As these players were at the time, still unproven, their winning probability is low.
- The 2019 Champions, the Toronto Raptors, had the second-lowest probability among champions to win a title. They went on to beat two superior teams in the Milwaukee Bucks and the Golden State Warriors to win it all.
- The 1996–98 Chicago Bulls led by Michael Jordan had the best three-year stretch by any teams that won championships consecutively.
- The classifier predicts the 2015 Golden State Warriors to have a 100% chance to win. This prediction is a bit surprising considering that the Warriors were arguably a much better team in the subsequent seasons.
- The 2000s had multiple teams with lower than average winning probabilities go on to win it all. Standing out is the 2004 Detroit Pistons who are renowned for winning without a true superstar.
Next, we can run a K-Means Clustering algorithm on every team’s winning probabilities to identify distinct groups within which each team.
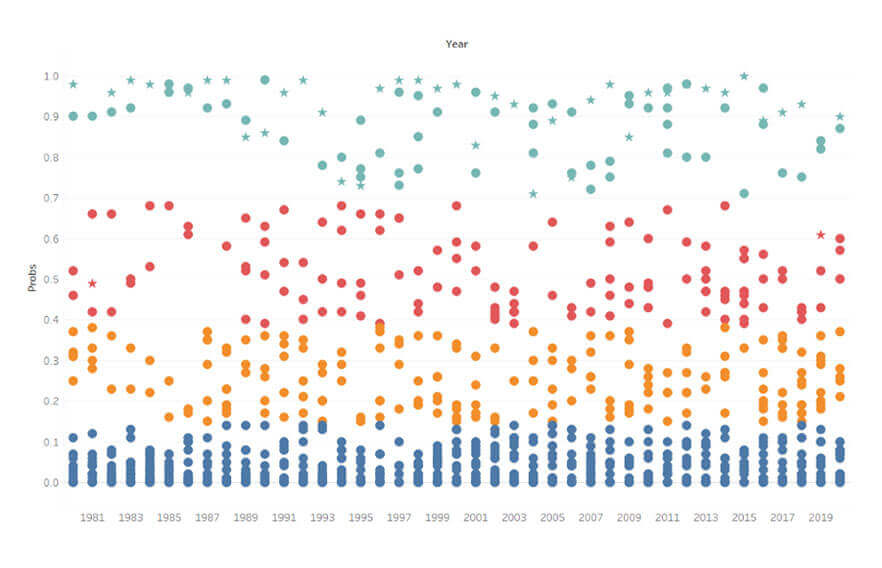
We see that every team falls into one of four distinct clusters. These clusters indicate (from top to bottom):
- Title Contenders — Teams that are heavily favoured to win a championship in that year. These teams typically have multiple superstars and rank near the top in wins.
- Dark Horses — These are great teams that have the potential to beat title contenders and go on to win the championship.
- Middle of the Pack — Decent teams with good players and a good number of wins but nowhere near to properly contend for a title.
- Bottom-dwellers — These are bad teams with not many good players and losing records.
Based on this clustering, we can simplify the first two clusters into “Contenders” and the next two into “Non-Contenders”.
After doing this, we can find out which teams have been title contenders for the most amount of time from 1980 onwards.
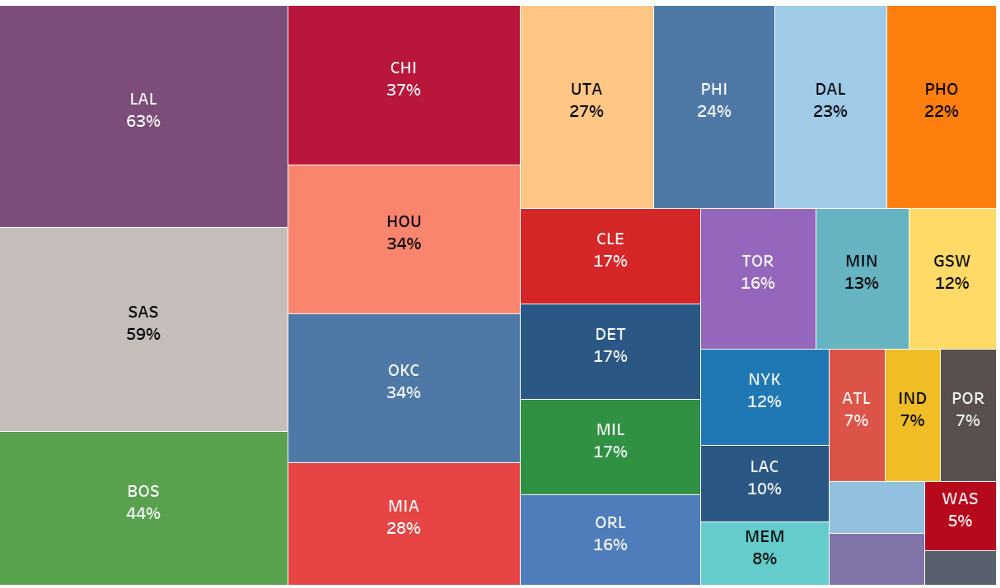
The above figure shows each team and what percentage of the time they have been contenders. The bigger the area of the rectangle, the longer the team have been contenders.
From this, we can take away some observations:
- The Los Angeles Lakers and San Antonio Spurs were in title contention for more than 50% of the time. This incredible consistency was possible due to the team drafting a young superstar along with smart team-building around the superstar. This ensured that the team would be competitive almost always.
- Other teams like the Chicago Bulls and the Boston Celtics also enjoyed success led by their all-time great players but dropped off rapidly after these players retired.
- Apart from a few years, most of the other teams were not in title contention. Multiple factors such as poor drafting, injuries and a lack of culture might explain why these teams never becoming quite good enough.
Learnings and Takeaways
What started as an exploratory exercise to predict the chances of a team winning a championship led to several learnings and takeaways for me:
- Understood how unbalanced datasets adversely impact the accuracy of a classifier and learnt methods to resolve this issue.
- Learnt additional ways to evaluate classifiers which were extremely useful in this situation.
- Implemented K-Means Clustering algorithm to identify clusters which helped to distinguish contending teams from non-contending teams
- Spotted a few reasons why some teams remain contenders for a long time and why others don’t.
Before concluding, a final note — my method of measuring Team Composition Strength does not take into account age, injuries and lower productivity. I believe that by correcting this, the classifier would be even more powerful.
Python code — https://github.com/vishwak-29/NBA-Championship-Odds-Prediction/blob/main/NBA%20Championship%20Odds%20Prediction.py
All data collected from Basketball-Reference.
Ref : https://towardsdatascience.com/how-can-we-leverage-ml-to-predict-nba-championship-odds-56290e9870e4