
The most pronounced outcome of the digital revolution is the sheer amount of data collected and analyzed. However, keeping pace with today’s exponential rate of data creation is not an easy task, which is why we focus on developing smart machines and models to do a chunk of the work for us.
These Machine Learning models can generalize future data well, but it involves making assumptions and require thoughtful consideration of the data at hand. Data scientists help organizations identify patterns and make predictions on what is likely to happen by combining computer science, modeling, statistics, analytics, and math skills with sound business sense.
However, businesses also often reach for classical Machine Learning tools to solve decision-making problems, such as setting the price or which customers to target with a marketing campaign. There is a significant gap between making a prediction and making a decision, so how can we go one step further?
Apples, Oranges and Spurious Correlations
Whether a Machine Learning model is good or bad depends on the data it is fed. This is why data scientists spend hours pre-processing the data to carefully select the features that would contribute most to the resulting model’s quality.
Correlation is an essential tool for this. It is a statistical measure that expresses the extent to which two variables are linearly related, i.e., whether they change together at a constant rate.
However, correlation does not imply causation, and one cannot legitimately deduce a cause-and-effect relationship between two variables solely based on an observed association between them. But when observations show a chart’s lines to be sloping together or bars rising together, it is natural human tendency to assign a reason, create a narrative and arrive at a cause-effect conclusion.
Statistically, we cannot make that leap. However, as Tyler Vigen, a student at Harvard Law School, demonstrated on his website, more often than not, variables are associated but not causally related, due to either coincidence or the presence of a particular third, unseen factor. These are called spurious correlations.
The charts on his website depict farcical correlations-for example, between Apple iPhone sales and people who died falling down the stairs. Although it is easy to spot and explain absurd examples like these, it becomes difficult to ascertain the truth when one encounters rigged but plausible charts. Without randomized experiments and causal reasoning, correlation-based methods can lead us astray.
Why Bother With Causations?
Judea Pearl, in his ‘The Book of Why?’ perfectly explains the need for causality –
We know that oranges prevent scurvy, isn’t it enough to have that irrefutable correlation? But what if you ran out of oranges? Not knowing the real causative relationship, Vitamin C, you might try bananas.
For businesses, this could mean the difference between a windfall of profit or a complete downfall. Consider the following scenarios, which presents the illusion of causality –
Scenario 1
Company XYZ has created a new shopping app. Uninstall rates are very high despite the app having a convenient user interface and not being too heavy. A more in-depth look into the data shows that there is a correlation between cart abandonment and uninstalls.
The best approach to tackle this situation would be targeting cart abandoners with remarketing or offering a guest checkout option. But what if cart abandonment was not the cause of uninstalls?
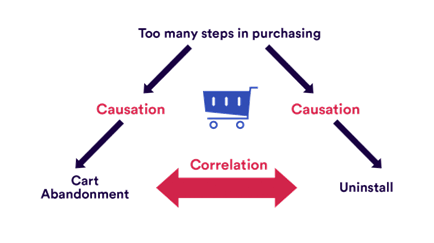
If the real issue causing both cart abandonment and uninstalls was too many purchasing steps that deterred customers from the actual checkout, all the actions suggested above would prove unhelpful.
Scenario 2
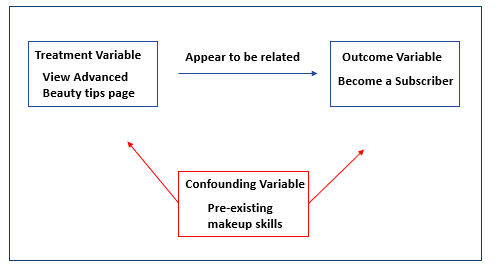
A Beauty and Personal Care company wants to get customers to buy their subscription plan. After running a market mix model, the observation showed that almost everyone who clicked on their “Advanced BeautyTips” page is a subscriber. Hence, they placed the page more prominently on the website and launched an email campaign to notify non-subscribers of this page’s existence. To their surprise, the campaign resulted in fewer subscriptions.
Why did this happen?
While there was a correlation between viewing the Advanced BeautyTips page and existing subscribers, it was not causally connected and hence did not make users more likely to subscribe. In this scenario, most likely, the people who viewed the “Advanced Beauty Tips” page were experienced beauticians. By encouraging users who had not yet subscribed to view the “Advanced Beauty Tips” page, the company was intimidating novice beauticians and dissuading them from subscribing.
To do or Not To do: When Should We Act on Correlations?
The answer to this question depends on two implicit questions –
- Will this correlation reliably occur in the future?
- What is the tradeoff between the risk and reward of the action?
Back in 2014, BCG had developed a prism through which any potential action can be evaluated as shown below –
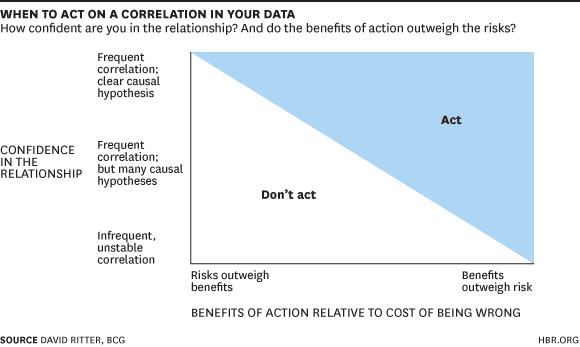
The graph suggests something we all know intuitively – it would make sense to take action when the benefits far outweigh the risk, even if the correlation is weak. It is similar to looking both ways before crossing the street because the cost of looking is low and the potential loss from not looking is high. Alternatively, if the risk is too high and we don’t have a solid understanding of why two events are linked, then the action needs to be reconsidered.
It is essential to distinguish cause from correlation to go beyond prediction and forecasting and understand how variables influence each other and how we can use interventions to change a system.
Sometimes, when working with Big Data, correlation is enough. But other times, understanding the cause is vital. The key is to know when a correlation is enough and what to do when it is not.
Causal Inference to the Rescue
Causal Inference is a technique used to determine whether changes in a variable X CAUSES change in another variable, namely Y.
The gold standard for establishing cause and effect is randomized controlled trials or A/B tests. However, we cannot always conduct such experiments as they are expensive, time-consuming, and at times unethical. Instead, we rely on observational data and statistics to get us the answer.
Diving Deeper: Basics of Causal Inference
There are two widely accepted frameworks for Causal Inference:
Structural Causal Models by Judea Pearl
Judea Pearl presented a causal metamodel that involves a three-level abstraction, which he terms as ‘the ladder of causation’. From the bottom-up, these are:
- Association – Seeing / Observing – “Oh, sales and price seem to be correlated.” This statement is purely statistical or observational – like finding patterns in the input data, which is often expressed as correlation.
- Intervention – Doing – “What will happen if we double the price?” This question involves reasoning or predicting the results of deliberation actions.
- Counterfactuals – Imagining – “What would’ve happened had we not done it?” This question involves constructing a theory that explains why specific actions have specific effects and what happens in the absence of such activities.
Structural Causal Models are mathematical models representing causal relationships within a population. Usually, the structure of a causal model is shown in the form of a Directed Acyclic Graph (DAG) as shown below:
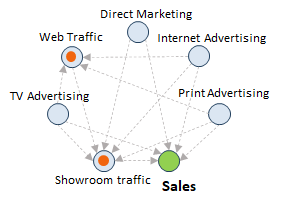
The arrows represent a causal link, i.e., the arrow from A to B implies A causes B. Here, we set sales as the target variable directing the focus to answer ‘What Causes Sales?’
Another term that becomes highly relevant in this domain is Confounders – these are variables that influence both the dependent and independent variables. In our previous example, too many steps in purchasing is a confounder. More often than not, the unobserved confounding variables that cause a spurious correlation seen in two seemingly unrelated variables.
Many sophisticated tools have been developed to learn the DAG from observational data. However, these are still in nascent stages, and we must incorporate domain knowledge into these graphs to make them more relevant.
Potential Outcomes Model by Donald Rubin
If we are interested in the outcome of intentional changes in a treatment variable, then ‘Potential Outcomes’ are considered under each possible treatment option.
We cannot observe both potential outcomes for a person simultaneously. This dilemma is known as the “fundamental problem of causal inference.” For example, if a person takes medicine, we will never know what would have happened if she hadn’t. I.e., We cannot estimate the unit level causal effect. However, with certain assumptions, we can estimate the population-level average causal effect.
(Hopeless) : What would have happened had I not taken medicine
(Possible) : What would the rate of remission be if everyone took medicine vs. if no one did?
For this, we divide the population of interest into treatment and control groups. The difference of their mean is the Average Causal Effect.
In several circumstances, such randomized experiments are not possible due to ethical or practical concerns. In these scenarios, Causal Inference saves the day by simulating the randomized trials from observational data using many statistical methods such as propensity score matching and inverse probability of treatment weighting.
Conclusion
Causality is mostly about interventions – about doing. Standard statistics is all about correlations, often leading to wrong assumptions and, inadvertently, wrong decisions.
Understanding ‘why’ something is happening can help us adjust methods and goals in response to our output instead of cycling through methods and tactics, hoping that one of them will work.
Trusting your models for decisions requires them to make causal sense. Achieving truly significant performance gains often depends on understanding and addressing the underlying causes of a situation. Our experts at LatentView Analytics can help you uncover the causes and make sustainable growth-oriented business decisions.
Are you interested in learning more? Please get in touch with us or email us at marketing@latentview.com