


.svg)
.svg)



TL;DR
VizX is LatentView’s automated visual evaluation framework that scores enterprise dashboards against 10 structured UI/UX principles.
- Across our BI delivery engagements, we have observed that, 70% of data-driven decisions still fail — not because of data inaccuracy, but because of how insights are visually delivered.
- Manual visual auditing consumes 2 to 3 hours of analyst time per review cycle and stalls multi-report deliveries by days.
- VizX evaluates every dashboard against a dual-layer framework: 6 Visual UI Principles and 4 Functional UX Principles.
- Output is an objective VizX Score out of 10 plus a prioritized checklist of visual liabilities — delivered in a minute or two.
- Measured results: up to 80% less manual design review time and 2x faster end-user adoption.
- Zero-Retention Data Privacy clears every uploaded asset the microsecond processing concludes.
The Visual Validation Gap Nobody Is Measuring
Enterprises measure data quality rigorously — but leave the visual delivery layer almost entirely unmeasured.
Across enterprise analytics engagements, one pattern surfaces with uncomfortable consistency: organizations invest heavily in building strong analytics capabilities, yet a staggering 70% of data-driven decisions still fail, not because of data inaccuracy, but because of how insights are visually delivered.
The problem lives at the insights delivery layer, where fragmented layouts and a total lack of cognitive hierarchy quietly undermine stakeholder trust at the exact moment a dashboard is meant to perform.
Despite rigorous investment in data governance and modeling, the final mile — visual asset quality — remains almost entirely unmeasured. Manual visual auditing has become an invisible operational liability, one that slows deployment lifecycles without ever appearing on a project risk register.
Without a standardized review framework, every dashboard that reaches stakeholder review carries an unquantified quality risk, and most organizations have no reliable way of knowing it.
The Real Cost of Subjective Design Reviews
Subjective reviews create inconsistent standards, burn specialized BI talent, and quietly delay analytics value delivery.
The financial and operational consequences of this gap are more significant than most analytics leaders account for. When subjective design reviews replace structured validation, the costs compound in four ways:
Inconsistent standards across teams. What passes review in one business unit would fail in another, with no objective basis for either decision.
Misallocated expertise. Highly specialized BI talent ends up spending valuable cycles manually auditing dashboards for layout alignment, color compliance, and spacing — work that directly diminishes data ROI and pulls focus away from strategic analysis.
Cycle time drag. In our own client engagements, a single review cycle routinely consumed 2 to 3 hours of analyst time, and multi-report deliveries stalled stakeholder timelines by days.
Late-stage rework. Design issues caught after stakeholder review are significantly more expensive to fix than those caught at the validation stage.
Stalled data monetization is rarely attributed to the review process. In practice, it is one of the most consistent contributors to delayed analytics value delivery.
Moving From Opinion to Objective Methodology
The fix isn’t more reviewers — it’s redefining visual quality as something structured and measurable.
The permanent fix to this hindrance is not hiring more reviewers or adding more checkpoints; it is a structural shift in how visual quality is defined and measured.
Rather than treating UI/UX as a matter of personal taste, integrating standardized design rules and layout logic directly into the development lifecycle preserves cognitive hierarchy and creates a repeatable, defensible quality standard.
Every hour spent debating subjective design preferences is an hour not spent on analysis that actually moves the business — and that trade-off adds up quickly across enterprise-scale delivery.
The industry already applies rigorous, automated standards to data quality, pipeline governance, and model validation. The insights delivery layer deserves the same level of institutional rigor.
When visual asset evaluation becomes as structured and measurable as data validation, the entire analytics delivery lifecycle tightens. This is where VizX comes in.
The Dual-Layer Heuristic Framework: 10 Principles That Define Visual Quality
VizX evaluates every dashboard against 10 principles across two layers — interface precision and human cognitive experience.
At the core of VizX is a dual-layer heuristic framework that evaluates every dashboard against 10 structured UI/UX principles, split across two distinct domains that together cover both the mathematical precision of interface design and the human cognitive experience of using it.
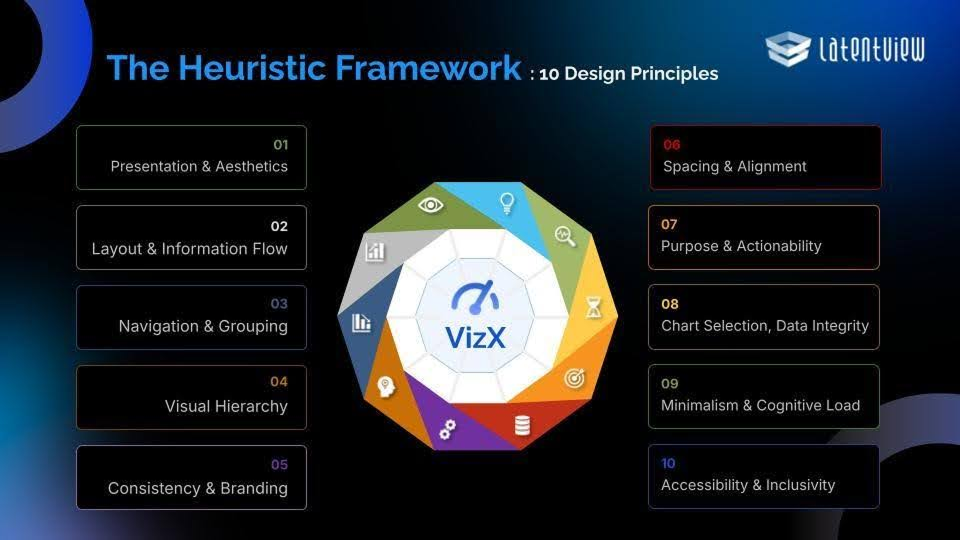
Layer 1 — Visual UI Principles (Automated Design System Check)
Principle | What It Evaluates |
|---|---|
Presentation & Aesthetics | Overall visual polish |
Layout & Information Flow | How the eye naturally traverses the dashboard |
Navigation & Grouping | Logical placement of related filters and controls |
Visual Hierarchy | Whether critical KPIs are prioritized over secondary charts |
Consistency & Branding | Adherence to corporate design systems |
Spacing & Alignment | Pixel-level grid compliance |
Layer 2 — Functional UX Principles (Human Usability Protection)
Principle | What It Protects |
|---|---|
Purpose & Actionability | Whether a decision-maker can act on the data presented |
Chart Selection & Data Integrity | The right chart type for the right data story |
Minimalism & Cognitive Load | Prevents information overload that causes decision fatigue |
Accessibility & Inclusivity | Color blindness compliance and text contrast standards |
Together, these 10 principles replace individual reviewer judgment with an institutionalized, repeatable evaluation standard that holds every dashboard to the same bar, every single time.
What Your Team Can Do With VizX
- Validate design consistency across all dashboard elements
- Check visual alignment to ensure every component is placed accurately
- Refine dashboards faster with actionable improvement suggestions
- Deliver more intuitive and impactful dashboards
The Architecture Behind the Evaluation
A serverless, multimodal pipeline delivers enterprise-scale speed and security without loading core networks.
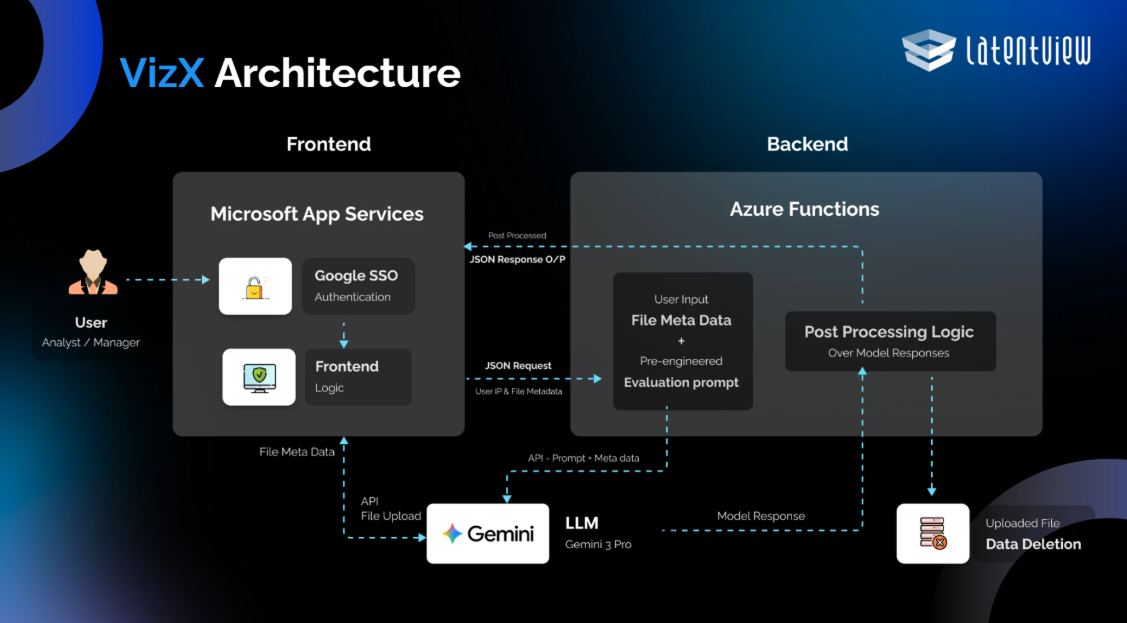
What makes VizX viable at enterprise scale is not just the framework — it is the underlying execution architecture that ensures speed, security, and reliability without placing load on core enterprise networks.
- Frontend ingestion. The analyst inputs contextual parameters — Account Name, Domain, and Entity — and uploads a high-resolution image or multi-page PDF of the visual asset.
- Direct-to-cloud transfer. Rather than routing this heavy media payload through the core execution server, the file binary is transmitted directly to a secure cloud infrastructure, which caches the asset and returns a lightweight storage location pointer — keeping processing speeds fast and server load minimal.
- Serverless orchestration. A serverless orchestration layer, built on Azure Functions, intercepts this pointer alongside the frontend metadata, dynamically binding them to pre-engineered evaluation prompts and structuring a unified request payload.
- Multimodal evaluation. This unified payload is routed to a specialized multimodal AI engine powered by Gemini 3 Pro, which natively parses layout geometries, spatial alignment, color data, and compositional structure simultaneously — going far deeper than any standard text-based model could.
The result is a thorough, multi-dimensional visual audit. In plain terms: the system reads your data product the way an experienced design reviewer would, but with the consistency and speed that no human process can match at scale.
From Analysis to Actionable Output
Findings arrive as a quantitative VizX Score out of 10, not a subjective narrative.

Once the evaluation is complete, VizX delivers its findings as a structured, quantitative output rather than a subjective narrative. The system generates:
- An objective VizX Score out of 10 — a single, defensible quality metric reflecting the dashboard’s performance across all 10 heuristic principles
- A targeted, prioritized checklist of visual liabilities that need to be addressed
- Both delivered within a minute or two of submission
This scoring mechanism removes individual reviewer bias entirely, replacing it with an institutionalized baseline of professional delivery standards that applies consistently across every enterprise analytics team.
For the first time, design quality becomes something that can be tracked, compared, and improved over time — not just debated in review meetings. Every dashboard that passes through VizX carries a documented quality standard, giving analytics teams a credible, evidence-based foundation when presenting work to executive stakeholders.
Built for the People Doing the Work
VizX removes repetitive pixel-checking so analysts can focus on turning data into strategic narratives.
VizX was not built to replace the analyst; it was built because we value what analysts are actually hired to do.
BI visualizers and data practitioners carry the complex, intellectually demanding work of translating raw data into strategic narratives, and that is where their expertise creates real organizational value. Spending hours in repetitive pixel-checking loops and back-and-forth review cycles is not that work, and VizX was designed specifically to take that burden off the table.
Zero-Retention Data Privacy
For enterprise analytics teams where data confidentiality is non-negotiable, the framework incorporates Zero-Retention Data Privacy: an automated data deletion routine that completely clears every uploaded dashboard from the secure environment the exact microsecond processing concludes.
Unlike public AI tools that log media assets for model training — creating a serious data leakage risk — VizX guarantees absolute asset security with no residual exposure, making it deployable even in the most compliance-sensitive enterprise environments.
The Business Case for Automated Visual Intelligence
Measured outcomes: 80% less review time, 2x faster adoption — and a different conversation with executives.
The operational outcomes are concrete and measurable:
Metric | Impact |
|---|---|
Manual design review time | Reduced by up to 80% |
End-user adoption rate | Accelerated by 2x |
Both metrics directly reflect the speed and quality of analytics value delivery. But the longer-term strategic impact runs deeper than efficiency gains.
When every dashboard your team delivers is held to a documented, consistent quality standard, the conversation between analytics teams and executive decision-makers shifts from defending design choices to acting on insights.
At LatentView, we believe the next frontier of enterprise analytics is not just better data; it is better delivery of that data to the people who need it most. Every dashboard your team builds carries real effort, real expertise, and real strategic intent behind it, and it deserves a review process that reflects exactly that.
See VizX in action — request a demo →
FAQs
What is VizX?
VizX is an automated visual evaluation framework that scores enterprise dashboards against 10 structured UI/UX principles, returning an objective VizX Score out of 10 plus a prioritized checklist of visual liabilities.
How long does a VizX evaluation take?
Results are delivered within a minute or two of submission — compared to the 2 to 3 hours a single manual review cycle routinely consumes.
What file formats does VizX accept?
High-resolution images and multi-page PDFs of the visual asset, submitted alongside contextual parameters for Account Name, Domain, and Entity.
Does VizX replace BI analysts?
No. VizX was built to remove repetitive pixel-checking and back-and-forth review cycles so analysts can focus on translating raw data into strategic narratives — the work their expertise is actually hired for.
Is uploaded dashboard data retained or used for model training?
No. Zero-Retention Data Privacy clears every uploaded dashboard from the secure environment the microsecond processing concludes. Unlike public AI tools that log media assets for model training, VizX leaves no residual exposure.
What are the 10 principles VizX evaluates?
Six Visual UI Principles (Presentation & Aesthetics, Layout & Information Flow, Navigation & Grouping, Visual Hierarchy, Consistency & Branding, Spacing & Alignment) and four Functional UX Principles (Purpose & Actionability, Chart Selection & Data Integrity, Minimalism & Cognitive Load, Accessibility & Inclusivity).
What measurable results does VizX deliver?
Up to 80% reduction in manual design review time and a 2x acceleration in end-user adoption rates across enterprise analytics teams.
Can VizX be deployed in compliance-sensitive environments?
Yes. The zero-retention architecture and direct-to-secure-cloud transfer make it deployable in the most compliance-sensitive enterprise environments.
How do I get started with VizX?
Request a demo and our Microsoft CoE team will walk you through a live evaluation on one of your own dashboards.





