
In the previous blog on AB Testing workflow, we delved into experimentation and statistical testing basics. In this blog, let us explore:
- The unpredicted effects of external forces (Novelty Effect and Instrumentation Effect) on the AB Testing/Experiment results and how to validate the results against these effects to check if the inference holds
- Experimentation best practices.
What is Novelty Effect?
The outcomes of the AB experiment can either be an actual effect due to the feature or the novelty of the feature. Novelty describes the desire to check out the new change that tends to diminish over time.
Consider the example below where an image slider (treatment) replaces the dropdown carousel (control). This feature increases user effort as they need to click the slider button to know all the suggestions. Whereas in control, a dropdown carousel displays multiple suggestions.
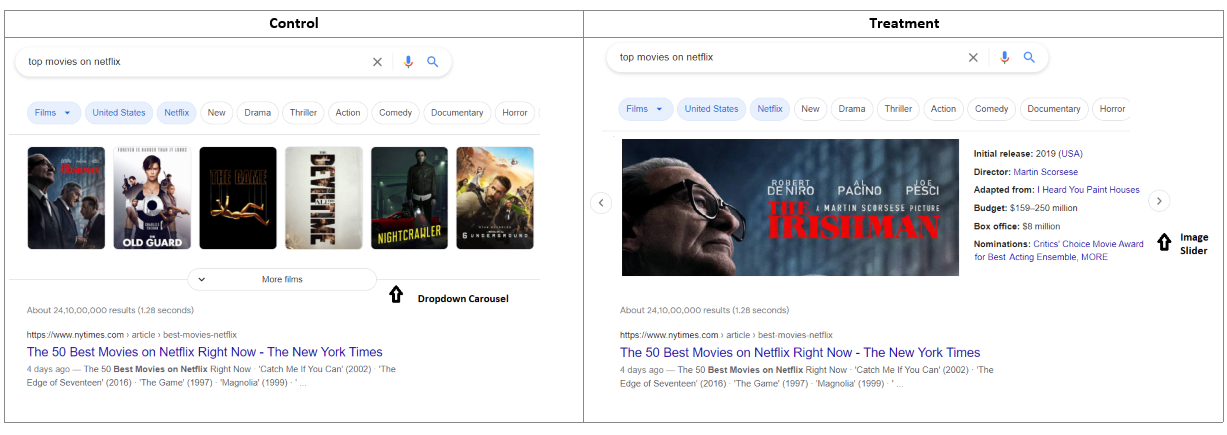
Initially, users might have checked out the image slider feature as it piques their curiosity since it is something new and different. As a result, this might show high user engagement due to several clicks. But after the initial days, users tend not to interact with this feature as it consumes much effort and would instead check out web result pages.
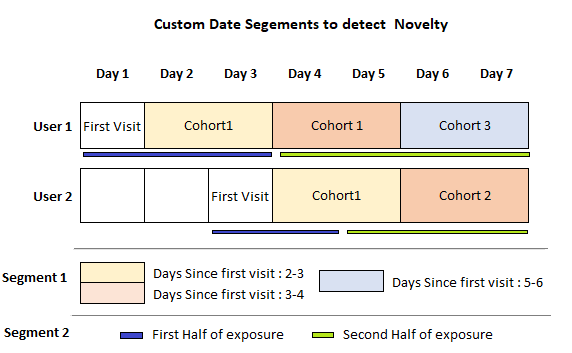
Novelty Detection Techniques: Run the testing/experiment for a longer duration and slice the data based on custom date segments. Compare between different cohorts in a segment to infer the effect. Some of these custom segments are:
- Experiment dates: Usually, metric value peaks during the first few days and drops later. So, we can compare metric movement on different dates to check for novelty patterns.
- First vs. Second Half Exposure: For each user, divide their time in the experiment into two halves. Check if metric movements are diminishing in the second half compared to the first half.
- Days/Week since the first visit: After each user’s first day in the experiment, divide their remaining days into ‘n’ equal buckets. Compare metric movement between each bucket to see if impact is diminishing towards the end.
What is Instrumentation Effect?
Some errors arise due to testing tools and code implementations. The Instrumentation Effect occurs when the tool used is faulty or the deployed metric calculation is wrong. Incorrect deployment can lead to the wrong interpretation of results. Apart from these, metric definitions and calculations need to be updated periodically. As the technology evolves, there are multiple factors to be considered while revising the metrics. Attention needs to be paid to the instrumentation effect more keenly than the novelty effect, as instrumentation is the foundation of the AB experiment.
AA test results can help us to identify this effect. If there is a difference in AA results, one reason might be the instrumentation effect. After that, to validate the AA inference, we need to understand the metric calculation and data processing steps. Details on the AA test setup are discussed in the next section.
Best practices for running AB-Experiment
- Calculate Sample Ratio Mismatch (SRM): In an ideal world, it’s hard to get an equal split between control and treatment. SRM is defined as the mismatch between the expected sample ratio and the observed sample ratio. With a 50/50 split, we expect the ratio between Control and Treatment sample groups to be 1:1. But in reality, we tend to observe a 49.85/50.15 split. In such a case, we need to ensure that we aren’t far from the expected ratio of 1:1. We need to perform a chi-square goodness of fit test to see if an observed ratio mismatch is different from the expected ratio. If there is SRM, then the inference will not hold true.
- Stop experiments using emergency shutdown rules on key metrics to prevent user churning due to bad experiences caused by features. For example, if the average page loading time is greater than five seconds in treatment compared to control, stop the experiment earlier. Set a separate mechanism that stops the experiment based on first-day data if there are large negative movements on key metrics.
- Collect AA experiment results: For users assigned in the AB testing, collect their data corresponding to 1 week before the start of the experiment. Since the experiment wasn’t started during this timeframe, the treatment version would be the same as the control version. So in the AA test, we will be comparing control against control. Hence, we expect no differences. AA results can help us to check –
- Instrumentation effect: If there is no bug in deployment, then AA results should show no differences.
- Selection Bias: If there is no user selection bias, then AA results should show no differences.
Conclusion
AB Experimentation is a widely applied technique in the eCommerce and Search engine industry to identify the best-performing variation of the product. However, AB experiment validation is often overlooked, which might lead to revenue loss in some cases due to external effects like Novelty and Instrumentation. Also, performing feature analysis is crucial in anticipating the impact and preventing potential user churn caused by underperforming features. Therefore, to implement an end-to-end AB experimentation process, follow the best practices, conduct feature analysis before the experiment, and carry out validity checks to ensure inferences hold true post the experiment.